


For decades, utilities have been collecting and analyzing data, and making business decisions based on these analyses. But they’ve never had as much data coming from as many devices on the grid as they’re getting today -- and that means that the next generation of utility data analytics may look very different from those that have come before.
Factors such as the proliferation of smart meters and grid sensors, the rise of distributed generation resources like rooftop solar and behind-the-meter batteries, and the emergence of customers equipped with new technologies to manage and control their electricity use are all bringing far more data into the utility purview than they’ve ever had to deal with before. And with much of this data flowing in close to real time, it's straining the bounds of the batch-processing, data-warehousing methods of data analytics tools of the past.
GTM Research has pegged the value of the global utility data analytics market at a cumulative $20 billion between 2013 and 2020, growing from $1.1 billion in 2013 to nearly $4 billion by decade’s end. This growth will be largely driven by this flood of new data, and the desire to turn it from an overwhelming deluge into streams of business value.
Enter the contenders for this massive new market. In the past half-decade, we’ve seen IT giants like Oracle, IBM, SAS, Teradata, EMC and SAP make big investments in the field. On the industrial front, Siemens is integrating its operations and data management technologies, and General Electric and partner Pivotal are creating “data lakes” that could be tapped for grid analytics. Startup C3 Energy, backed by $105 million in VC investment, has landed Baltimore Gas & Electric as a marquee customer for its massive integrated data analytics approach.
These all-inclusive, leave-no-data-point-behind approaches promise great rewards at the end of the day. But they’re expensive, and they take a long time to get up and running. They’re also premised on the idea that utility customers are willing to commit to significant upfront investments with as-yet-uncertain outcomes.
In the meantime, another breed of software tools are bringing a different approach to the utility data challenge. In particular, two startups, Space-Time Insight and Bit Stew, have been landing big utility customers by putting disparate data streams and stores to use in applications to solve today’s data management challenges -- not in years or months, but in weeks, or sometimes even days.
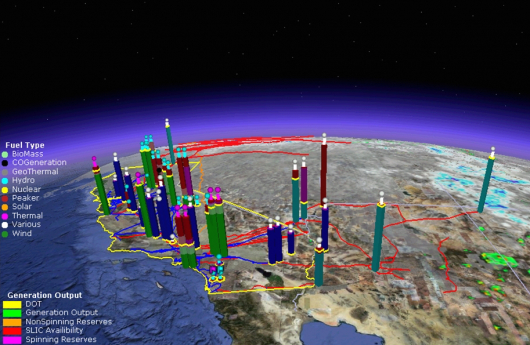
Photo Credit: Space-Time Insight
These companies aren’t promising to provide every last analytics applications utilities may want someday. Indeed, neither company bills itself as an analytics provider, per se. But they are offering utilities a way to gain a core understanding of what's going on with all their new networked grid devices. This, in turn, could serve as the launching pad for new analytics applications over time. In a utility data landscape that’s changing so quickly, this approach could well provide a model for the rest of the industry to follow.
Delivering real-world value in days, not years
Take Bit Stew, the Vancouver, Canada-based startup that got its start with hometown utility BC Hydro. At last month’s DistribuTECH conference, Bit Stew announced it has landed California utilities Pacific Gas & Electric, San Diego Gas & Electric, and Southern California Gas as new customers of its Grid Director platform, the software interface built on top of its MIx Core data engine.
In some cases, Bit Stew won those contracts in competition against some well-known competitors in the data analytics field, Franco Castaldini, the company’s vice president of marketing, told me. While he wouldn’t name them, he did say that the winning difference was Bit Stew’s promised ability to get its system up and running much faster than those of its competitors.
“Those customers are able to stand up a first instance of Grid Director, for example, with five different source systems, in two weeks, with one person,” he said. “That’s compared to a typical ETL [extract, transform, load] approach, where you’re taking data from source systems, and pushing them into Hadoop or Cassandra,” two well-known and much-used big data platforms -- a process that “can take months.”
That’s a critical capability for utilities that have been frustrated by past efforts to build an operational platform for putting their data to use, said Michael Allman, a former executive of Sempra Energy, the parent company of SDG&E and Southern California Gas, who joined Bit Stew as COO last month.
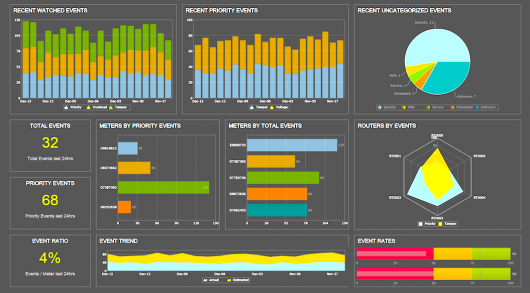
Photo Credit: Bit Stew
“If you look at an electrical utility, they’ve got a disparate [array] of subsystems, a number of them are homegrown, or systems they’ve been using for years, all from different companies,” such as customer information and billing systems, grid-asset health tracking systems, and distribution grid management systems. “How do you take all these different systems, coming in different data formats at high speeds, and turn it into actionable information?”
“Companies have tried to do this for years, and have been unable to crack it,” said Allman. “Bit Stew has been able to crack that nut -- and it has proven that now with several big customer wins, in very competitive environments.”
That’s a self-promotional description of Bit Stew’s capabilities, of course. But Castaldini, who previously led product marketing for GE’s Energy Management software solutions, agreed that traditional data management approaches have often struggled to solve these problems: “It slows down the project, it might break down the line, it frustrates the relationship between OT and IT, and it often leads to failure of potential projects.”
“How do you take all these different systems, coming in different data formats at high speeds, and turn it into actionable information?” Michael Allman, Bit Stew
What comes out of the other end of Bit Stew’s process doesn’t look particularly complex at first glance. Its first iterations with BC Hydro were aimed simply at supporting its smart meter deployment, from tracking the installation process to getting the Itron and Cisco wireless mesh network up and running.
But critically, that platform has since been put to use by BC Hydro to manage the everyday challenges of managing its smart meter network as a whole. Take the situation of a meter that’s not functioning properly: Is it due to a meter hardware failure, a network failure, or because somebody has ripped the meter from its socket? Having access to data streams on each of those possible points of failure, and being able to correlate each in relation to the other, can deliver an answer to questions like these, which separate systems can struggle to provide, he said.
Situational intelligence to clean up data and tie it together
Steve Ehrlich, vice president of business operations at Space-Time Insight, calls this kind of capability “situational intelligence.” The San Mateo, Calif.-based startup has built up an impressive list of utility and grid operations customers using its data visualization software, including Southern California Edison, Hydro One, Florida Power & Light, San Diego Gas & Electric and California’s grid operator, California ISO.
Building up the comprehensive maps to represent the combined information from these disparate systems requires integration from data platforms such as EMC Greenplum, OSIsoft PI servers and geographic information systems (GIS) from vendors like Esri, he said. “We’re pulling that all into our development environment, and saying, here’s how all this data relates to each other, here’s how it goes into the map,” he said. “That’s happening, usually in days, inside the development tool.”
In so doing, it has discovered that many utilities are struggling with ensuring that the data analytics they’re using across different systems are, first of all, accurate, and second of all, properly correlated to one another. “We often call it the analytics of analytics -- just like data is siloed, the analytics is also siloed,” he said.
That process often starts with the simplest of questions about the quality of the data being put into the process. “A lot of utilities tell us, 'Our data’s not good enough to do an analytics project,'” he said. “We ask them, ‘How do you know?’ Their answer is, 'We don’t know; we just think that’s the case.' It turns out, just doing simple visualization is a huge benefit to figuring out how bad or good the data quality is."
Ehrlich offered one example from an unnamed utility customer: “When they first started to visualize assets, they were showing that they had assets in the middle of the ocean. That’s clearly [incorrect] data.” To fix the problem, the utility set up a “digital pushpin system” allowing experts to identify data points for correction, insert the correct data, and then have that propagate back into all the systems that provided the original -- and in this case, incorrect -- data.
“Someone’s going to want to check that, of course, but at least we can automate the process,” he said.
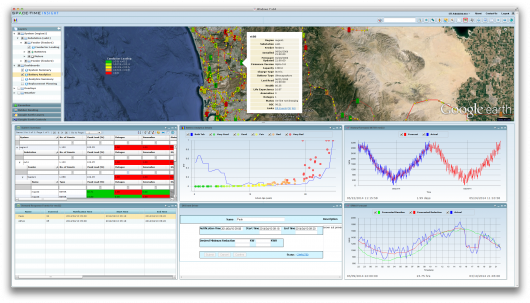
Photo Credit: Space-Time Insight
Bit Stew has also been helping its utility customers with this search for truth in data, Castaldini said, citing the example of one West Coast utility that has used the startup’s software to integrate 52 different data sources. “Once they’re able to bring all that data into a common data model, it started to close the discrepancies [between] what they thought was true, and what was actually accurate,” he said. “At first, [they] questioned the validity of the data we were presenting to them. Over time, we were able to work with them to show them that it’s not Grid Director, it's your data source that’s been giving you the wrong perspective.”
Another key tool for utilities is filtering and managing the alarms and alerts coming from existing utility systems, Ehrlich noted. One problem with alerts is that they often come without context to explain why they’re happening, he said. Also, they can be set in such a way that they go off too often, frustrating operators, or not often enough. Being able to check real-time alerts against the real-time data from Grid Director can really help the humans behind these systems turn that frustration into a plan of action for how to respond, he said.
Building the foundation for an ‘analytics apps platform’
Proving this ability to clean up and filter data from existing systems has been giving utility customers the confidence to start adding new features and functions to deal with new challenges, Ehrlich said. For example, Space-Time Insight customer Sacramento Municipal Utility District uses its platform to coordinate about 30 different data sources into an integrated view of smart meters, distribution grid systems and solar PV installations in its service area, he said. When utility operators started to see more plug-in electric vehicles coming onto its network, they turned to the startup to pull Department of Motor Vehicle data on customers who’ve bought plug-in EVs.
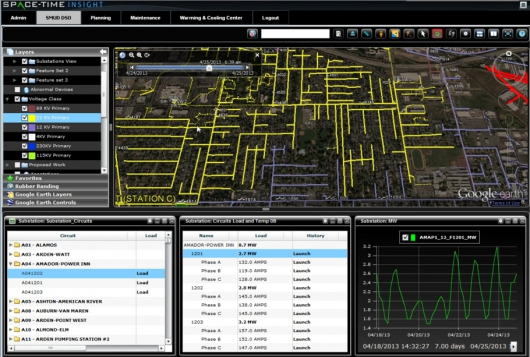
Photo Credit: Space-Time Insight
“Within 30 days, from the time of DMV data being available to being up and running in the application, they could see where cars are being charged, so they can know if they need additional capacity,” he said. This information, in turn, can be fed into the demand response management application, which “essentially helps the utility understand what is the most effective program -- who should participate [and] who already [signed up] and is not a good candidate to do it again,” and similar factors.
Bit Stew demonstrated another example of such an expanded use case at DistribuTECH: a map to show how wildfires could endanger grid assets.
“To be able to fulfill this use case, we had to take information in from the public fire services, as well as information off the SCADA system and GIS to understand asset conditions on the grid,” Castaldini said. “The real objective is to say, we have a fire, and we can model out what-if scenarios […] and correlate that with what equipment is out there on the distribution grid, to perhaps take some action earlier before you have a cascading effect” from power lines and transformers being caught in the blaze.
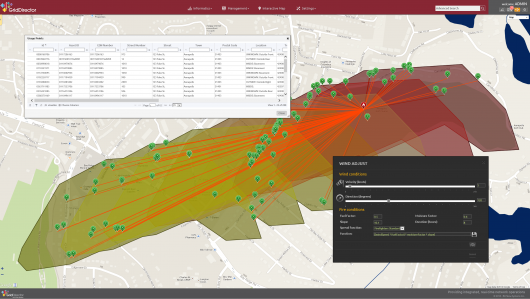
Photo Credit: Bit Stew
Building on these foundations, both companies are building out their own analytics applications. They're opening up their platforms to developers from utilities they’re working with and looking at broader markets beyond the energy space. Bit Stew has enlisted three California utilities in its Grid Director Developer Network to make it easier for in-house utility experts to build their own applications on top of the platform. Space-Time Insight is working with strategic investor NEC on applying its software to the Japanese giant’s energy storage business, as well as with transport and logistics companies to optimize scheduling and discover underlying reasons for slower-than-expected deliveries.
Why utilities need the fundamentals first
San Diego Gas & Electric’s smart meter operations center (SMOC) project represents how utilities are putting these principles into practice. The first phase, completed in early 2014, uses Space-Time Insight’s software to deliver data integration and visualization about its 2.1-million smart meter network, SDG&E spokesperson Hanan Eisenman said. That’s helped deliver improved situational awareness, early detection of alarms and events, and visual confirmation of network chokepoints, as well as providing more information about network characteristics for future analytics applications, he said.
SDG&E selected Bit Stew from among “numerous separate vendor proposals” for the second and third phases of its SMOC project, he said. Phase two, set for delivery in May 2015, will focus on analyzing meter data to identify and pinpoint network issues and non-communicating meters and network devices, and find data exceptions and mismatched records, he said.
Phase three, set to start this summer and deliver functional products through 2016, will build up multiple analytics applications, including asset management, performance trending, meter network simulated modeling, network and meter engineering, work management and enhanced early-warning outage detection, he said.
“Where people have gotten more traction now is in realizing this operational side and getting value out of their smart meters. That’s really where Space-Time Insight and Bit Stew are starting to show results.” Paul De Martini
That list includes many of the analytics functions that utilities around the world are hoping to build on top of their smart meter and networks, and Bit Stew’s Grid Director "was determined to be the most mature application that could be configured to meet SDG&E’s operational needs,” Eisenman said.
GTM Research has identified situational awareness as the next wave of investment for utilities. Simply put, traditional batch processing systems aren’t designed to manage utilities’ emerging operational needs, which require seeking out insights and exploring anomalies across multiple systems in close to real time.
Today’s situational awareness platforms are focused on visualization and streamlining control of these multi-system needs. But the next steps will require a move to streaming data processing, machine-to-machine communications, and predictive modeling of the ever-more complex systems being deployed across the utility.
This path from situational awareness to larger analytics applications demonstrates how utilities have adjusted their expectations since "big data" first became a buzzword in the industry, according to Paul De Martini, the former Southern California Edison and Cisco executive who helped lead those companies’ smart grid strategies. Over the past five years or so, utilities have been investing in data warehouses and historian systems, in search of tools to manage the new data problems they’re facing, he said.
But “those that spent a lot of money weren’t getting a big benefit out of it,” he said. “These are really great building blocks -- but they’re the things you need when you scale up. Where people have gotten more traction now is in realizing this operational side and getting value out of their smart meters. That’s really where Space-Time Insight and Bit Stew are starting to show results.”


 41
41
 15
15
 9
9