Seasonal trends, favorable conditions and ever-improving technology all came together in April to help America’s wind turbine fleet spin past coal’s capacity factor.
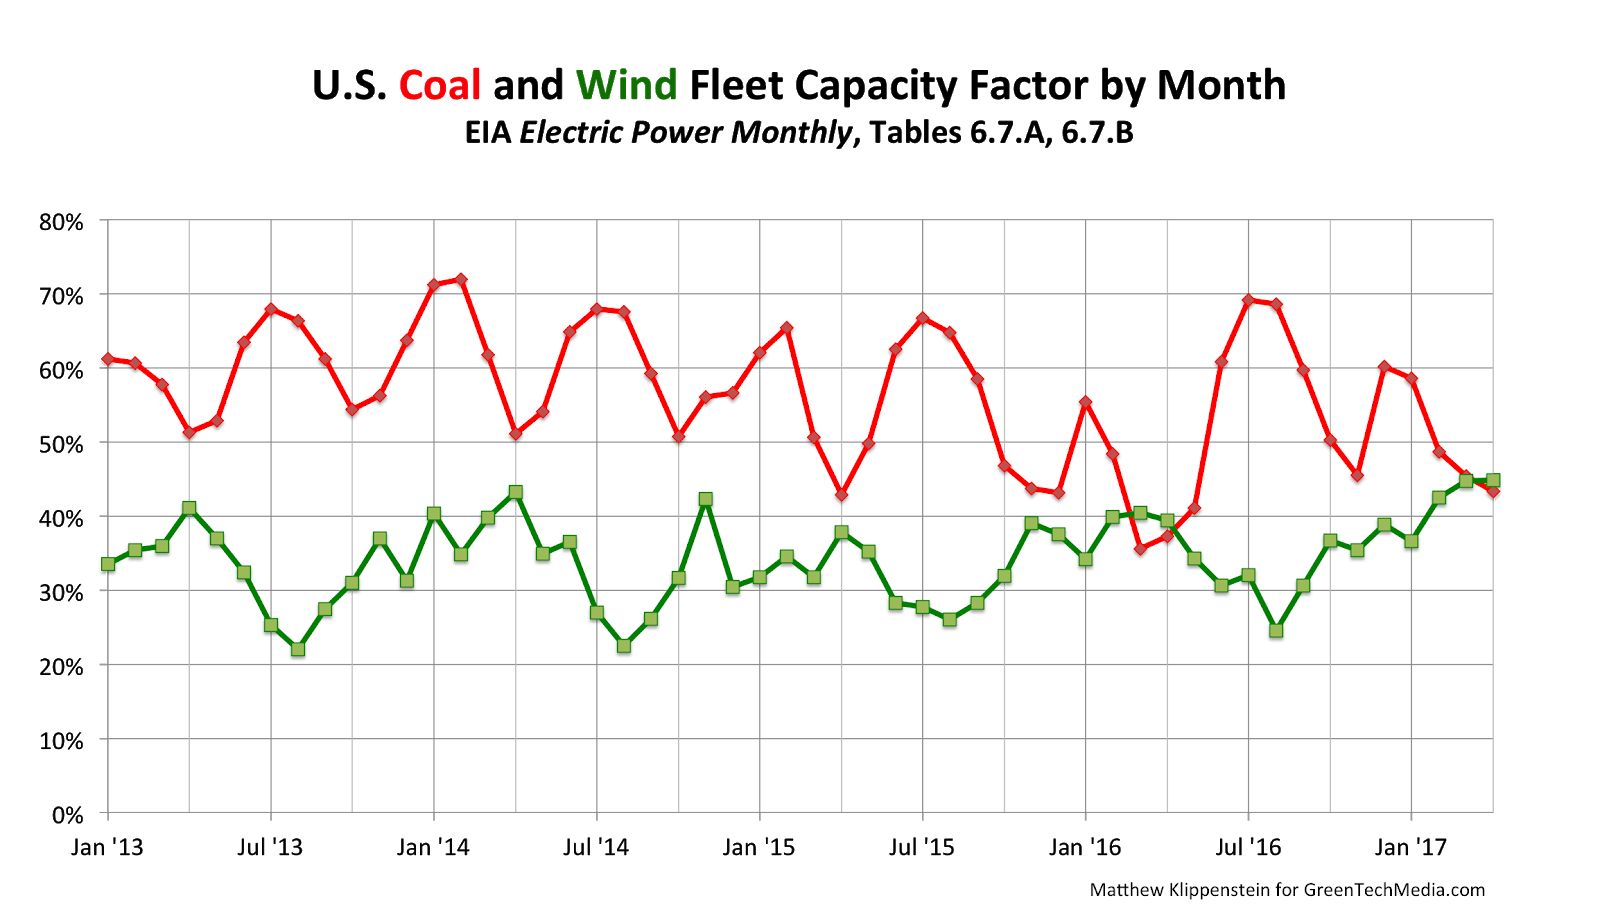
The Energy Information Administration's Electric Power Monthly (Tables 6.7.A and 6.7.B) put wind at 44.8 percent, slightly above coal’s 43.4 percent -- and just below the 45.7 percent of the nation’s combined-cycle natural-gas plants.
A closer look at these contributing factors will help give better context for this achievement, so we’ll review each in turn.
Seasonal trends
As seen from the chart above, the United States’ wind fleet saw its highest capacity factors around April, roughly corresponding to the nation’s lowest period of electricity demand (Electric Power Monthly, Table 1.2.A). This pushes down on dispatchable generation, causing fossil generators to experience their turbine capacity factors reaching annual lows around this time.
Last year, these factors pummeled coal’s capacity factor below 40 percent in both March and April, allowing wind to slip ahead of it, largely unnoticed, for a brief stretch.
Wind has not yet topped coal’s capacity factor in the fall months, though it made its closest approach in November 2015 (39.0 percent versus 43.6 percent). A combination of mild weather and low natural-gas prices will probably be needed for wind to hit this next milestone.
That said, coal’s capacity factor remains well above that of wind on an annual basis (52.7 percent versus 34.7 percent in 2016), and grid modelers generally take pains to distinguish between intermittent and dispatchable power.
Favorable conditions
March and April were both marked by higher-than-average wind speeds across key portions of the United States. April’s wind speed anomaly, based on Vaisala’s 5-kilometer (3-mile) resolution Numerical Weather Prediction data set, is reproduced below.
FIGURE: April Wind Speeds
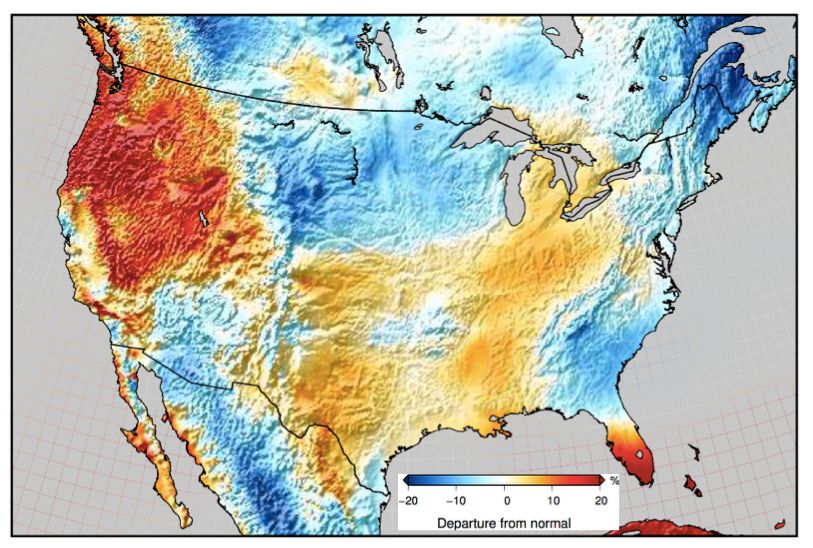
Source: Vaisala
Relative to historical April norms, wind speeds were modestly higher in Texas and Oklahoma, together home to about one-third of U.S. wind capacity, and considerably higher in the western states, which represent another 15 percent. Southern Florida also experienced stronger winds, but average wind speeds in the American Southeast are low enough that the region is essentially wind-farm-free.
While seasonal factors and favorable conditions converged to help the wind industry clock an auspicious April, technology improvements formed the core of long-term gains, as they have done in many other grid edge industries.
Technology improvements
Just as the solar sector has succeeded in squeezing ever more electrons, ever more cheaply, from sunlight, the wind industry has succeeded in wringing more watts for fewer bucks from each breeze. (GTM's reporting from last August provides a good backgrounder on that.)
DOE’s most recent Wind Technologies Market Report noted that wind farms completed in 2014 saw an average capacity factor in 2015 (the most recent year for which production data is available) of 41.2 percent. Utility-scale wind farms built between 2004 and 2011 averaged 31.2 percent and those built from 1998 to 2003 averaged 25.8 percent.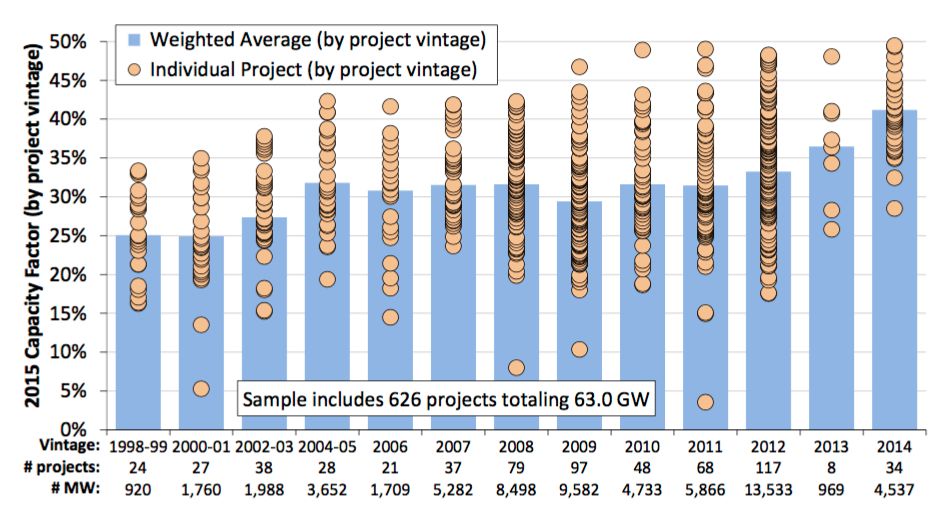
While technology has improved, capacity factors have crawled upward very slowly. This is partly due to year-over-year variations in the wind resource adding significant noise to the data set, and partly thanks to cost reductions making once-marginal projects (with lower capacity factors) economic for developers.
The increasing deployment of turbine designs optimized for lower wind speed regimes, even in high-wind areas, has provided a boost. The shape of wind speed distributions means there are advantages to being able to harvest more energy in gentler winds, even in the blusteriest locales. An analogy might be made with advances in solar module design that allow photovoltaics to convert more indirect or low-angle light; the panels can provide more kilowatt-hours even if their peak kilowatt rating doesn't change.
The step change in capacity factor in 2004-2005 coincides with the industry’s shift from 60-meter to 80-meter hub heights, providing access to higher wind speeds. In 2014, fully half of the new wind capacity tracked went into Texas and Oklahoma, versus one-third in the national fleet. This could mean there were fewer projects in lower-capacity-factor areas to bring down the average of the 2014 “vintage.”
Provident prognostications
Even as wind’s rise mirrors coal’s decline in American power generation, it seems likely that in most months, its capacity factor will continue to fall short of that of its fossil competitors. The long-awaited boom in American offshore wind should raise the wind fleet’s capacity factor, but progress along the cost curve should allow developers to profitably site (and grid operators to comfortably integrate) wind farms in ever-calmer counties, which would tend to decrease it.
Meanwhile, the coal plants likeliest to close will be the least economic ones, whose lack of competitiveness likely stems from low utilization rates. The Darwinian thinning of the herd could conceivably even raise the average capacity factor of the surviving coal fleet, despite the ongoing encroachment of intermittent renewables into so-called “baseload” power.
While few biologists have the opportunity to watch dramatic evolutionary changes unfold (microbiologists and entomologists excepted), we are at a juncture where energy analysts and students of the grid edge alike can see this transformation bloom. However the trends turn out, pondering such statistics enriches our perspective of the changes underway, and hopefully equips us to help accelerate them for our collective benefit.


 42
42
 15
15
 9
9