The duck curve graph started with the California Independent System operator, but when Jim Lazar, senior advisor for the Regulatory Assistance Project (RAP), put out a paper on how to change the shape of the duck in 2014, there was interest from China to the Middle East to Italy.
The duck curve shows the gap between the total load a utility serves and what that load looks like after a significant amount of wind and solar generation is added on the system. The graphic interpretation of that scenario looks like a sitting duck. The duck is an increasing concern for grid operators worldwide.
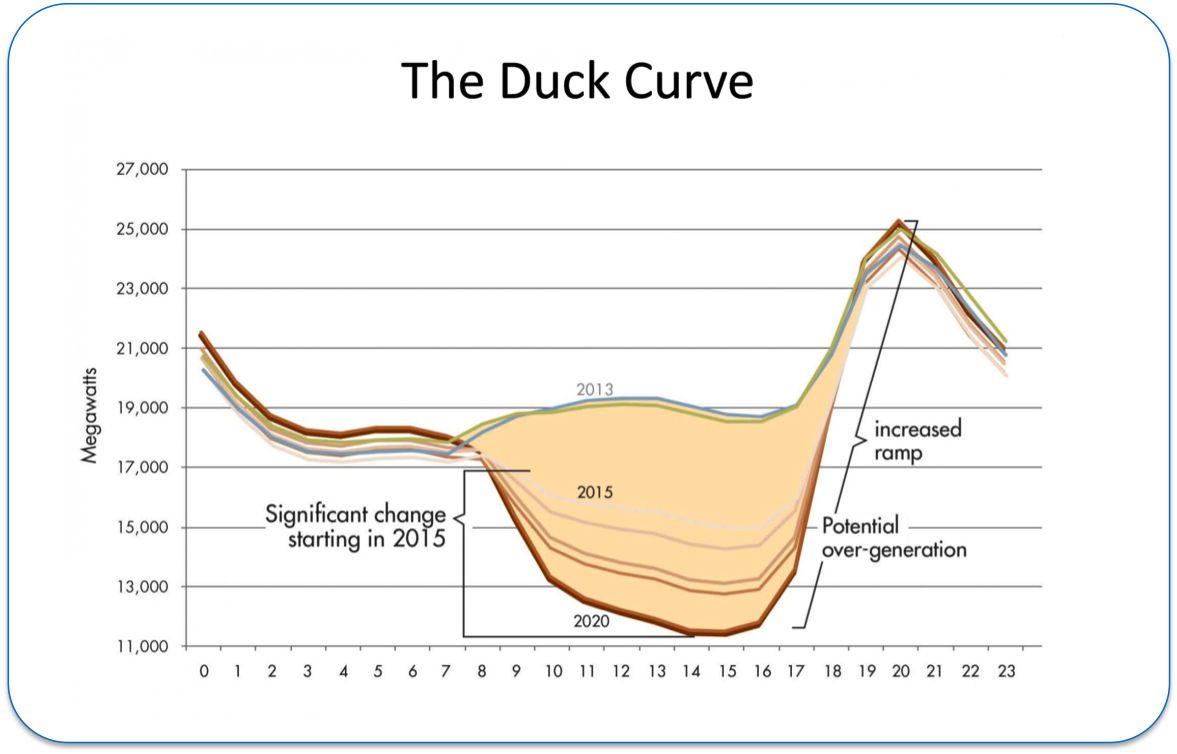
The global interest in Lazar’s work shows how utilities are increasingly planning for a future with high penetration of renewables, even if some regions will not get there for many years. In the first edition of the report, Teaching the “Duck” to Fly, Lazar argued that with 10 low-carbon strategies, the duck curve can be flattened out to look more like a flying, rather than a sitting, duck.
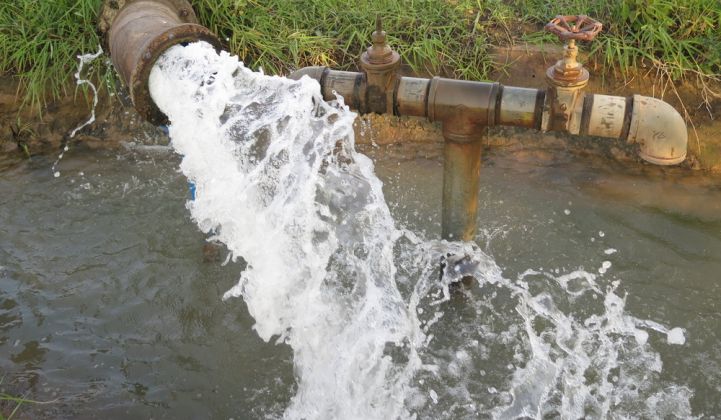
In the second edition, there are still 10 strategies, including targeted energy efficiency, rate-design innovation, peak-oriented renewables and more aggressive demand response. But one issue is far more prominent than it was in the first edition: water. For the first time, managing water and wastewater pumping loads has been added as a strategy. Water heating and ice energy also have more prominent roles.
Water pumping consumes about 7 percent of electricity in the U.S., a figure that is far higher in California. Currently, Lazar notes that most rate design for water-pumping encourages pumping at a uniform level throughout the day. But if water systems and irrigation pumps were upgraded with larger pumps that could be incentivized to pump off-peak via improved rate design, it could save up to 2 percent of the total electric load modeled. Upgraded pumps and more precise agricultural methods also have the benefit of using less water overall.
“The potential [savings] can be even greater if water and wastewater utility planning is conducted interactively within electricity least-cost planning,” wrote Lazar, “so that, for example, increased water storage capacity can become a substitute for increased electricity generation capacity.”
It’s not just better use of water in the agriculture and wastewater sector that could help tackle the duck curve. On a commercial scale, chilled water systems and ice storage are considered as a far more viable source of storing load than they were just two years ago by RAP. Now, the report considers 100 percent of central chiller load and the majority of the retail sectors as candidates for storage air conditioning.
Southern California Edison is already tapping ice storage in its territory through Ice Energy, while Austin Energy has a growing district ice energy system that has shaves about 15 megawatts off its summer peak demand.
Residential water use also received an update. Lazar wrote in the introduction that the first edition of the report “dramatically understated the potential of water heating and air conditioning storage technologies.”
Controlling most of the 45 million electric water heaters in U.S. homes could provide the load shaping and storage to allow for an additional 100 gigawatts of variable wind and solar, the study found.
While many utilities, especially cooperatives, have long used electric water heaters for demand response, some utilities are starting to tap them specifically for renewable balancing and investing in smart water heaters that allow for greater control.
Hawaiian Electric is testing smart water heaters to help manage the solar on its distribution system. Also in Hawaii, SolarCity just released a home energy system that includes a smart water heater for solar customers who want to join Hawaii’s Customer Self-Supply program.
Hawaii may be one of the first places investing in smart water heaters, but it is not the only region that could realize the value of the technology. A recent report from Natural Resources Defense Council has found smart water heaters could pay back up to $200 in grid services in the U.S. per year, offering a payback period of about five years. The RAP paper suggests that a good program design could target multi-family and rental housing units first, which could bring lower utility bills to many low-income customers while also providing grid services.
The availability of water resources is widespread for utilities that are starting to see grid impacts from renewables. But tapping them, and other technologies outlined by Lazar, is not necessarily simple, even though they’re readily available.
“Their implementation will, however, require time, effort, a change in the utility consumer relationship, some significant investment, and some serious resolve,” Lazar concluded. “Time is of the essence.”


 41
41
 15
15
 9
9