
As we move into 2016 with an international climate agreement and policymakers thinking about how to meet national commitments, it’s time to review the current status of U.S. power sector emissions and preview the energy trends shaping the next decade.
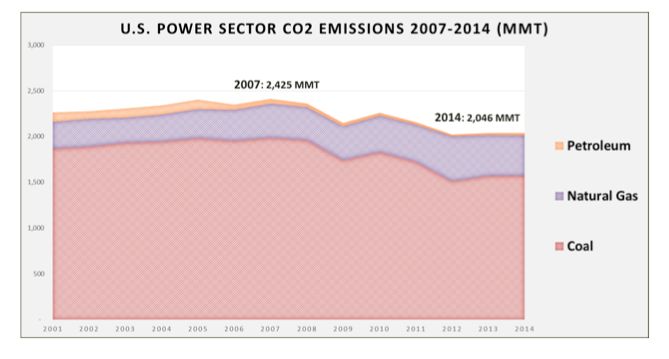
The basic facts: according the U.S. Energy Information Agency (EIA), power sector emissions peaked in 2007 at 2,425 million metric tons (MMT) and dropped to 2,046 MMT in 2014. What have been the dynamics at play since 2007? And what does this suggest about the future?
Energy efficiency
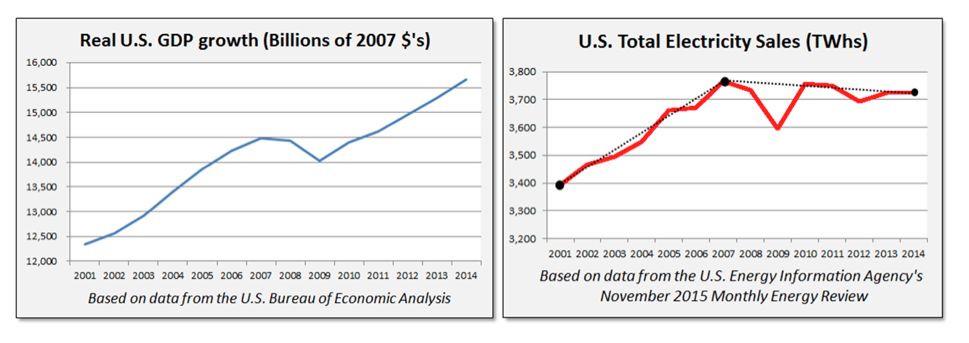
U.S. electricity sales decreased from 2007 to 2014, as shown in the right chart below. The chart on the left shows that overall economic growth continued after the Great Recession of 2008-2010, so the drop in electricity sales cannot entirely be explained by the recession and its aftermath.
Indeed, utility efficiency programs eliminated about 146 terawatt-hours of demand in 2014 alone, compared to 2007 expectations. Other work in this area suggests that codes and standards contributed another 65-terawatt-hour reduction in 2014 annual demand.
Utility-reported savings may be somewhat overestimated, but these numbers also leave out privately-funded customer and third-party improvements outside of the utility’s purview.
Given all this, the signs indicate efficiency is a substantial driver of lower demand -- to the tune of about 200 terawatt-hours, even once we account for the recession. This is especially important for traditionally regulated investor-owned utilities (IOUs), which drive profit by deploying capital, but are now faced with less demand for new infrastructure and a smaller sales base.
Moving away from coal
Coal is the biggest contributor to U.S. power sector emissions, which explains why the shift away from coal has reduced emissions. State policy, environmental standards and advocacy have driven down coal generation, while at the same time, natural gas, wind and solar have risen due to the shale gas drilling revolution and steadily decreasing costs of clean energy technology.
Uncertainty exists about how much coal use will continue to drop. Some analysts believe coal demand will remain steady, at least in the near term, while others are less sanguine.
Recently, the president of West Virginia’s largest utility told a roomful of energy executives “with or without the Clean Power Plan, the economics of alternatives to fossil-based fuels are making inroads in the utility plan,” and “companies are making decisions today where they are moving away from coal-fired generation.”
On the other end of the spectrum, the Sierra Club, whose “Beyond Coal” campaign carefully tracks the U.S. coal fleet, suggests coal generation is on the decline and the U.S. power sector is already on track to meet its 2030 emissions goals. Of course, plenty of policy, planning, and market design work remains to manage an intelligent transition away from coal.
Coal switch to natural gas
Since electricity supply must always meet demand, the drop in coal had to be counter-balanced by the rise of other generation sources as U.S. demand remained fairly flat. Natural gas has been the single largest source of replacement generation at 215 terawatt-hours, through increased utilization of the existing fleet (much of which was built in the early 2000s) and building new efficient combined-cycle power plants (CCGTs) and gas turbine peaker plants.
Meanwhile, older natural-gas plants have been going offline, resulting in increased efficiency of the gas fleet as a whole, and thus lower overall emissions.
Unfortunately, natural-gas generation still emits greenhouse gases and contributes to total power sector emissions, especially when it replaces lower-carbon generation like retiring nuclear plants. Beyond the greenhouse gases associated with natural-gas combustion, significant upstream emissions come from leaking methane, a highly potent greenhouse gas. Even with conservative numbers, this effect is large enough to completely wipe out the emissions benefits from the increased average efficiency of the gas generation fleet.
Wind and solar
Non-hydro renewable electricity generation ranked a close second to natural gas in terms of new generation added from 2007 to 2014, at 174 terawatt-hours (184 terawatt-hours if distributed solar is included).
Much of this deployment -- especially in the earlier years -- was due to supportive policies, like state renewable portfolio standards and federal tax credits. But declining costs for solar and wind are now driving deployment based on economics alone.
Some of the new wind and solar generation displaced coal and natural gas, resulting in reduced emissions roughly equivalent to the coal-to-gas switch at the combustion level. This is having an even greater emissions impact than the coal-to-gas switch if upstream methane leakage is taken into account. Trend lines also show annual generation from renewables has been ramping up exponentially, at first mostly from new wind, but increasingly from solar.
Distributed solar generation has received a great deal of attention and is on a steep growth trajectory, but today makes up only about a quarter of a percent of total national generation. GTM Research predicts the ITC extension will boost solar capacity additions 54 percent over five years and drive a 20 gigawatt annual market by 2020 -- meaning solar is set for an ever-increasing role.
While solar and wind are variable on a day-by-day basis, they are remarkably consistent and predictable on an aggregate annual basis, most likely due to their modular and geographically distributed nature. The challenge of integrating variable resources has so far proved quite manageable through better forecasting and smarter dispatch of a diverse portfolio of supply- and demand-side resources, and by taking advantage of existing flexibility in the grid.
Hydropower and nuclear
Hydropower and nuclear already represent a significant portion of America’s clean power mix -- together providing over a quarter of total generation -- but they are not expected to grow.
Hydropower is mature, with most good sites already used and struggling to satisfy multiple public mandates (although some repowering may increase output). On top of that, hydro exhibits significant variation in annual output that must be balanced on a year-to-year basis, but on shorter timescales hydro can be fairly flexible and can help integrate variable resources on a day-by-day or hour-by-hour basis.
EIA forecasts nuclear power will hold steady or slightly increase by 2020 as a couple new plants compensate for retiring ones, but delays and cost overruns for these new plants don’t bode well for the future of nuclear in the U.S.
Additionally, existing plants have had trouble competing economically in wholesale power markets, putting several plants at risk of retirement without power market reform. Still, a handful of new companies are exploring new designs, and smaller more modular plants may breathe new life into the industry over the longer term.
Final thoughts
Technological innovation, market trends, and smart policies have added momentum to the transition to a lower-carbon U.S. power sector. As the clean energy transition continues, however, strategic institutional reforms and additional forward-thinking policy will be required.
The most important near-term goal will be improved regulatory structures to stimulate new utility business models and provide a clear framework for customers and third parties to participate.
In the medium term, electrifying cars, trucks, and some industrial processes will prove important -- especially where these new sources of demand are dispatchable.
Finally, as large-scale renewables and distributed energy resources become a larger share of the total electricity mix, wholesale power markets will need to evolve to value flexibility and optimize across distributed and centralized resources.
***
Eric Gimon represents America's Power Plan.


 41
41
 15
15
 9
9