
New solar module rankings from Principal Solar Institute (PSI) based on manufacturers’ own data could add downward pressure to solar prices and move the industry to higher quality standards.
“You always hear about dollars per watt,” explained PSI Executive Director Matthew A. Thompson. “That is a comparison. It helps make some decisions early on, but what you really need to know is how much energy a solar project is going to produce over its lifetime.”
PSI identified seven key characteristics that measure and describe a module’s energy output. “We took these seven characteristics and used publicly available data, largely from the manufacturers themselves,” Thompson explained, “to create a model that would show the modules' 25-year lifetime energy production [LEP].”
The just-launched ratings system, developed over the course of a year, emerged from developer Principal Solar’s aim to identify the best project acquisitions and the best panels for new developments.
“The seven characteristics are a great start,” noted Michigan Technological University professor Joshua M. Pearce, co-author of a landmark solar LCOE study. “The industry must maintain consumer and investor confidence that modules will produce the lifecycle electricity promised. There are reports that some companies are selling lower quality modules to keep up with falling prices.”
The just-released rating system white paper details the seven characteristics.
1. Actual Tested Maximum Power vs. Advertised is the power value and “a primary factor in the design of any solar power system.”
2. Negative Power Tolerance is the manufacturer’s deviation from its design target. “Higher quality production lines control this variation better and manufacture products with a smaller (tighter) tolerance.”
3. Temperature Coefficient at Maximum Power describes the decreasing power output with increasing temperature. “Products with a higher temperature coefficient will have lower LEP.”
4. Nominal Operating Cell Temperature (NOCT) is the characteristic operating temperature of a module. “A higher NOCT amplifies the negative effect caused by the temperature coefficient.”
5. Power at Low Irradiance / Power at High Irradiance Ratio reflects a PV module’s performance in off-peak conditions. “The insolation response combined with the daily insolation is a key component of the LEP.”
6. Annual Power Reduction shows the degradation of a PV module’s output over time from lab testing. “It is of extreme significance to the manufacturers’ warranty policies [and] is used to calculate LEP and contributes to a PV module’s PSI Rating.”
7. Total Area Efficiency is “the degree of coverage of a module” with cells.
Thompson hopes to eventually add a measure that will capture panel durability. “The potential for absolute failure in the field is not part of the seven characteristics, because data is not available from the manufacturers,” he said. But financiers and developers with hundreds of millions of dollars at stake want that information, Thompson said. He hopes to convince more manufacturers to submit their modules for testing. “When failure rates are known, durability will become an eighth characteristic.”
Click here for the complete interactive listings.
Two numbers were derived from the seven characteristics: the PSI rating and a percentile.
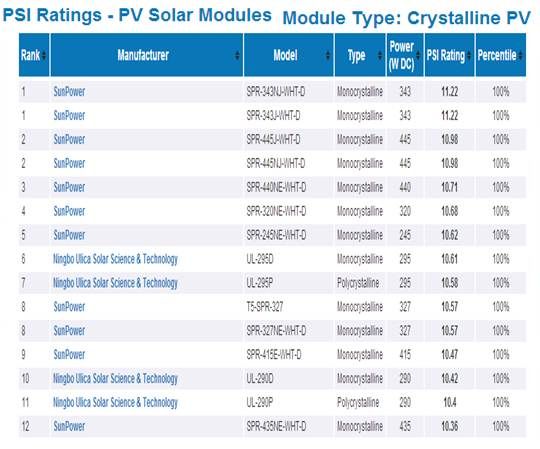
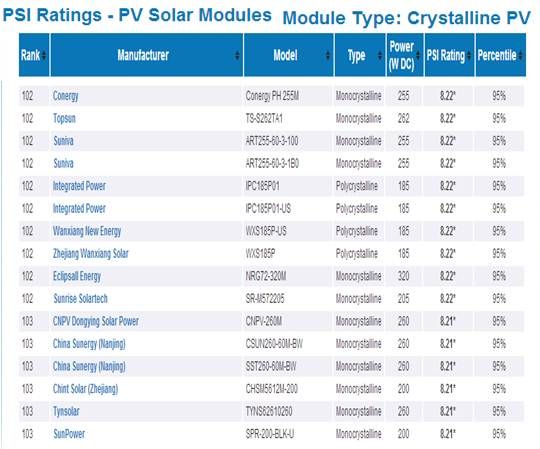
“On the crystalline PV list,” Thompson explained, “we only display 500 of the database’s 10,000 modules, from 375 manufacturers. The percentile ranking is the percent of all modules in the database to which that module’s performance is superior.”
The rating number was derived to share the findings without compromising Principal Solar’s competitive advantage, Thompson said. “We invented the concept of an ideal PV module with 100 percent efficiency that does not waste a single drop of sunlight. It has ideal values for all seven characteristics.”
Industry-leading modules, he went on, “produce somewhere in the ten megawatt-hour range over their 25-year lifetime. We divided the calculated LEP by the ideal LEP. That is the PSI rating. It is a ratio.”
The PSI rating and percentile ranking can provide a side-by-side comparison of modules, Thompson said. Price and other factors should be considered. “This is just one factor in the due-diligence process.”
The model does not reflect location, he noted. It cannot, therefore, compare module performance in south Texas versus Massachusetts. “One of the goals of the institute is to develop that level of research [in the future].”
The SunPower (NASDAQ:SPWR) 343-watt (DC) module is SPI’s top-rated panel with a 100 percentile ranking and a PSI rating of 11.22, almost 7 percent better than the number-six Ningbo Utica’s PSI rating of 10.61, Thompson said. “But maybe the Ningbo costs 20 percent less. That might make it a better value.”
A developer planning on buying 10,000 modules could, Thompson suggested, go to SunPower to negotiate a better price.
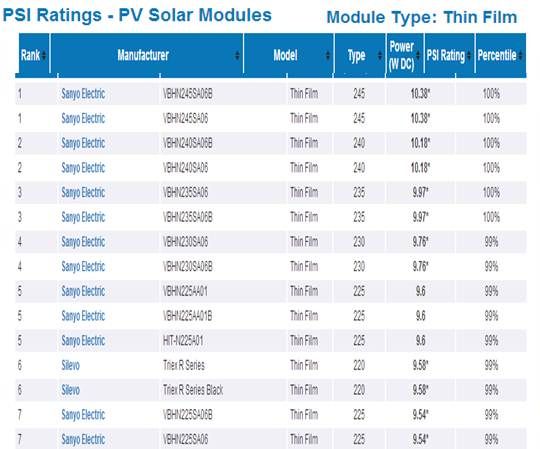
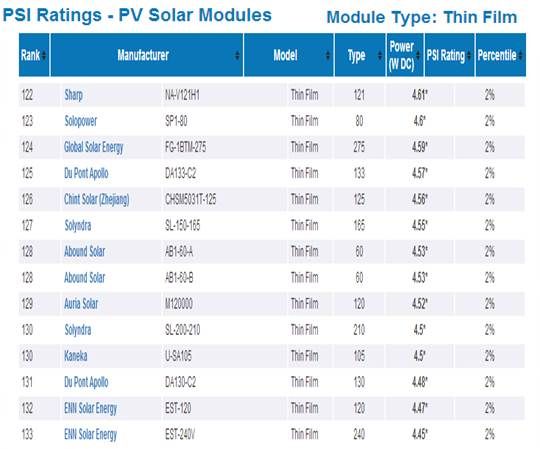
Thin film modules are listed separately. The top 500 modules on the crystalline list go from 100 percent to 95 percent of the ideal LEP. The 250 modules on the thin film list go from 100 percent to 2 percent. “I’m not yet sure how to compare thin films,” Thompson said.
Because the ideal LEP calculation is proprietary, to protect PS Inc.’s competitive advantage, the ratings have not been validated by a neutral third party. Thompson said users can decide from the method described in the white paper whether to trust the numbers’ legitimacy.
“I was unable to find their formula for combining the seven characteristics into a single score,” Pearce pointed out. “Similarly, I did not see any mention of them yet in the academic literature. Publishing their protocols openly and all the data would be an enormous benefit for solar PV.”
Click here for the complete interactive listings.


 42
42
 15
15
 9
9