
The following is an excerpt from the latest U.S. Solar Market Insight report, published by GTM Research and SEIA. Download the free executive summary here.
Year-over-year, overall solar PV system pricing has fallen by 2 percent to 18 percent, depending on the market segment, with the largest declines in ground-mount PV systems.
FIGURE: Modeled U.S. National Average System Costs by Market Segment
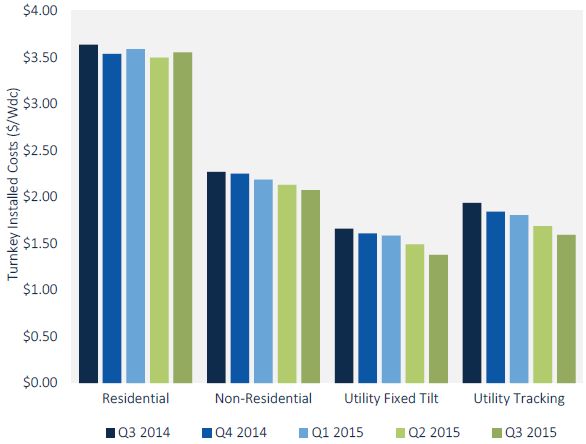
Source: GTM Research / SEIA U.S. Solar Market Insight
On a quarterly basis, pricing continues to trend downward, with some leveling-off in the residential sector due in particular to strong investment in customer acquisition ahead of 2016. In the non-residential and utility sectors, we see declines of 3 percent to 7 percent, reflecting continued aggressive cost reductions in national system pricing.
Markets with a large footprint, such as California, continue to have a disproportionate effect on overall national average pricing, which can vary by as much as 20 percent from state to state. Variations in utility system costs are much smaller than variations in residential and non-residential costs.
Average pricing for residential rooftop systems landed just above $3.50 per watt, with nearly 60 percent of costs coming from on-site labor, engineering, permitting and other soft costs. While residential hardware costs have fallen by over 14 percent in the past year, soft costs have actually risen by 6 percent on an industry average basis.
The trend is indicative of persistent challenges in lowering permitting costs and rising expenditures in customer acquisition that have not yet yielded additional installed capacity. As the industry continues to consider market expansion, these soft costs remain under intense scrutiny from large and small installers alike.
While utility system pricing is more tightly clustered than residential and non-residential system prices, state-by-state variation is prevalent, with states in the Southeast U.S. leading on lowest system costs. In the third quarter of 2015, a high proportion of projects located in North Carolina with lower costs (especially in regards to labor) played a significant role in bringing national pricing downward for utility fixed-tilt systems. However, utility EPCs and developers continue to leverage a heavily competitive supply chain and maturing system installation practices to reduce costs across the board.
FIGURE: Average U.S. System Cost Breakdown by Market Segment, Q3 2015
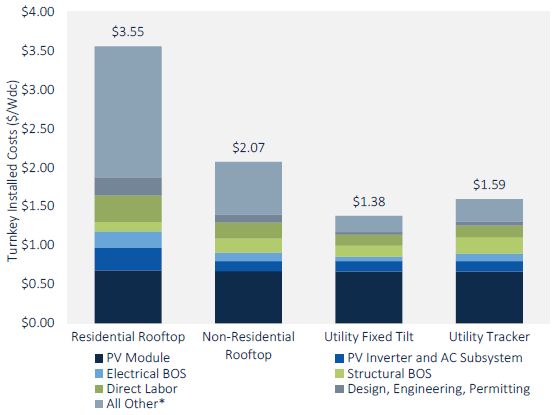
Source: GTM Research / SEIA U.S. Solar Market Insight
***
The full U.S. Solar Market Insight report provides state-level installation numbers, pricing, policy analysis and forecasts. Learn more here or contact [email protected].


 42
42
 15
15
 9
9