Legacy hydroelectricity -- clean, dispatchable and cheap -- has long dominated the renewable energy sector as a dependable workhorse. But by the decade’s end, wind may end up wearing the capacity factor crown.
Capacity factor is the ratio of a generator’s annual power production to the power it could have produced if it ran at 100 percent rated capacity 24/7. It’s a valuable measure of the generator’s ability to operate at its full potential and maximize the value of sunk-cost capital investments. Last year the United States nuclear fleet managed a capacity factor of 92 percent, while coal plants and combined-cycle natural gas generators managed 55 percent and 56 percent, respectively. As recently as 2008, coal’s capacity factor was 73 percent.
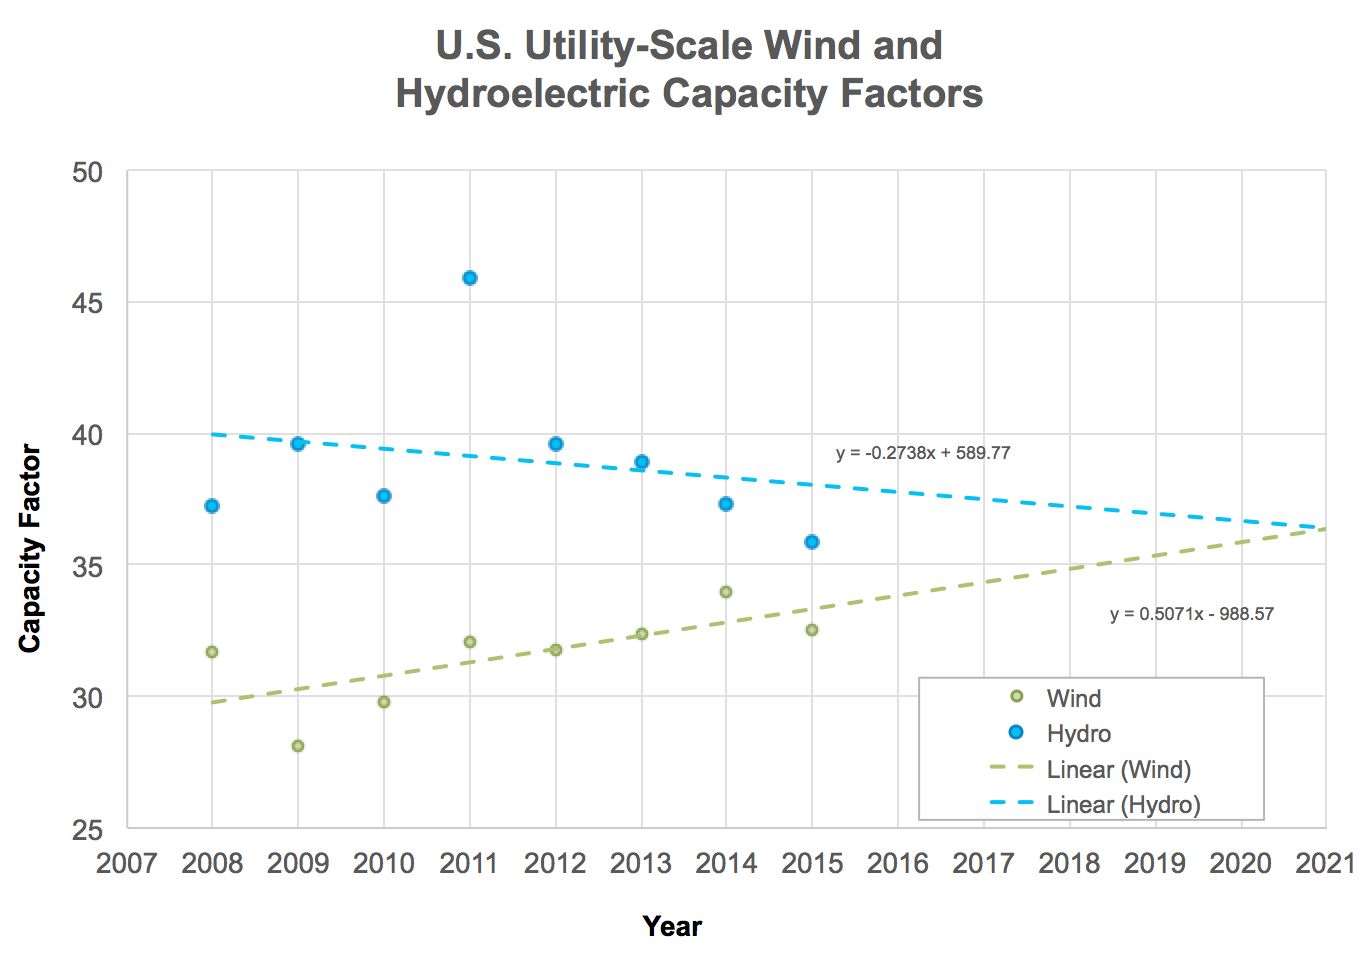
The capacity factor for conventional dam-based hydroelectricity is lower -- in the 40 percent range -- owing to its use as flexible, load-following supply. Despite the continuing shuttering of coal capacity, hydro’s capacity factor has been slowly declining since 2008 as natural gas, wind and solar have seamlessly stepped in, while electricity demand has remained flat. The EIA estimates that gross U.S. electricity consumption fell 2 percent from 2007 to 2015, despite concurrent population growth of 8 percent.
Droughts have also been a factor; until the welcome wet weather this winter, operators struggled to maintain water levels in reservoirs. Lower water levels mean less hydrostatic head is available -- and incrementally more water needs to be released -- to generate each megawatt-hour, exacerbating reservoir management challenges. At the end of 2016, Lake Mead, which feeds the Hoover Dam, had dropped more than 130 feet (one third of an NFL football field, with end zones) since the turn of the millennium, falling to its lowest levels since it was filled in the 1930s. Robust water conservation efforts now underway will reduce water demand, thereby decreasing the Hoover Dam’s capacity factor.
Innovation is powering wind to reliability
The capacity factor of the U.S. wind fleet has steadily risen over time, reaching a record 34 percent in 2014 before dropping to 32.5 percent in 2015 on account of a continent-wide wind drought. Through November 2016, the fleet was tracking just behind 2014 levels.
Technology has largely driven the increase in wind’s capacity factor, as taller turbines with longer blades now harvest more kinetic energy from faster winds, over a larger swept area. Capacity factor last year for U.S. wind projects built in 2014 averaged 41.2 percent, compared to 31.2 percent for projects built in the 2004-2011 timeframe.
These new wind farms have steadily increased the capacity factor of the American wind fleet. Even as wind’s expansion has moderated from its pace of five years ago, the current five-year annualized growth rate (about 15 percent) would result in a doubling of the fleet in five years.
Extrapolating the eight-year trend in wind and hydro capacity factors gives a crossover point in 2021 at a capacity factor around 36 percent.
“Orthodontics for wind farms”
Capacity factor improvements have not been limited to new wind farms. Technological innovations have made it possible to optimize existing wind farms as well. In forested areas, remote sensing and computational flow dynamics can inform changes to the local cultivation of trees, which can improve energy production with minimal impact. Five forested sites for which SgurrEnergy has consulted in Sweden and the United Kingdom have seen increases of 1 percent to 5 percent in annual energy production (AEP).
Other solutions are more broadly applicable. Ground-based lidar can be used to optimize wind turbine generator alignment to ensure the rotor plane stays perpendicular to the wind and harvests a maximum of energy. SgurrEnergy’s experience with its Galion Lidar has been that such yaw correction typically improves AEP by 1 percent to 2 percent. We have observed a further 1 percent to 3 percent AEP increase through improved control strategies.
Independently verified results on a Clipper C96 2.5-megawatt turbine at the University of Minnesota found that SgurrOptimizer’s Individual Blade Controller also reduced blade loads by 10 percent, suggesting O&M cost savings of up to 5 percent should be achievable. Finally, aerodynamic enhancement of turbine blades -- typically by the installation of vortex generators to improve airflow near the surface -- has been found to increase AEP by 2 percent to 3 percent for older blade designs.
Individual Blade Controller Performance
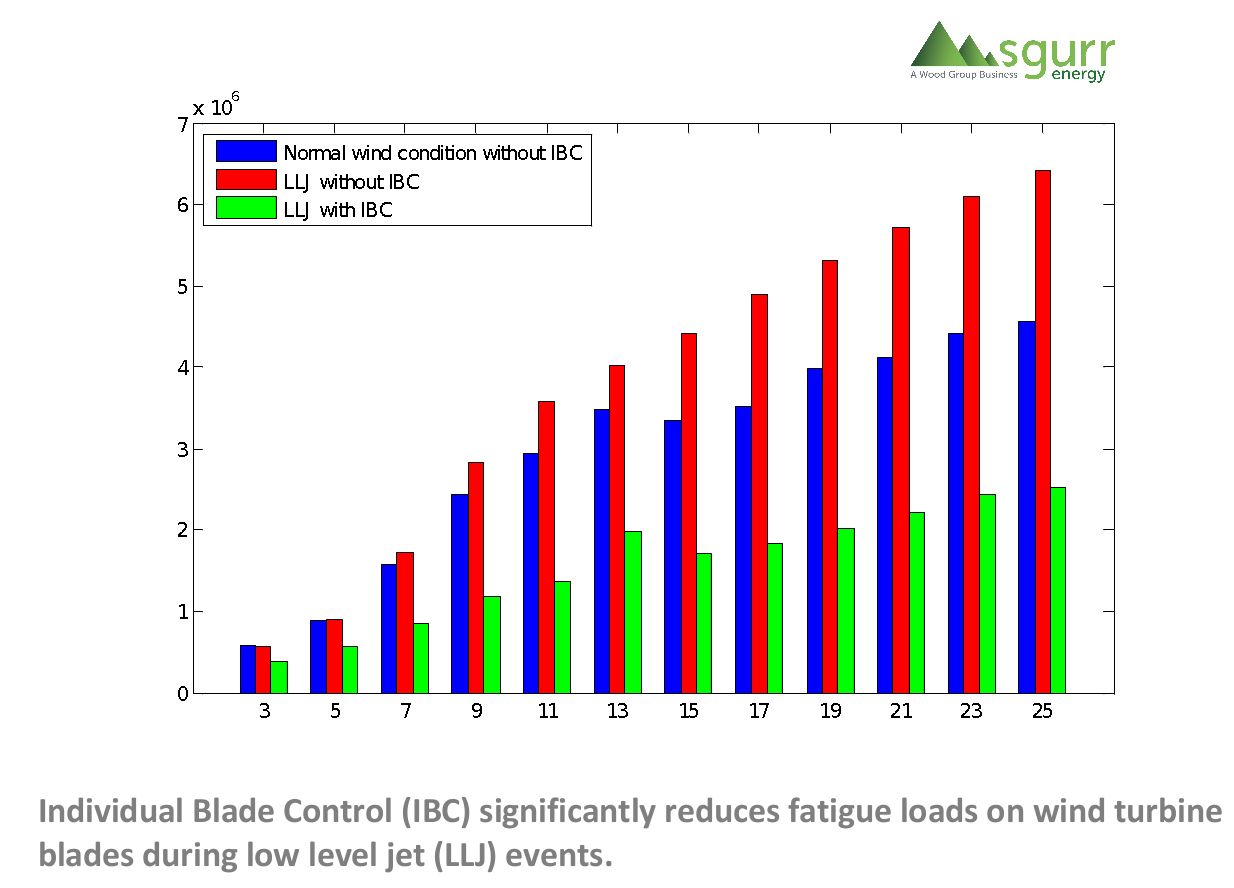
Together, these techniques -- labeled “orthodontics for wind farms” by some -- can make for a 4 percent to 8 percent increase in AEP, independent of forestry-related gains and O&M cost savings. Taking the middle range, their application across the U.S. wind fleet would raise its average capacity factor from 32.5 percent to 34.5 percent. If such a change could be effected overnight, the expected wind-hydro capacity factor crossover point would come forward to 2018.
The dollars and sense
Emphasizing single-digit percentage improvements in annual energy yield can strike some readers as much ado about -- to quote a prominent CEO -- “mouse nuts." These are none the less significant, due to the scale of wind farm developments. For a 100-megawatt wind farm operating at a 35 percent capacity factor, a 6 percent increase in AEP would raise annual production from 307 gigawatt-hours to 325 gigawatt-hours. Assuming a conservative price of 2.3 cents per kilowatt-hour, the additional 18 gigawatt-hours would generate $410,000 of additional revenues -- and an equal value of production tax credits.
Assuming a net profit margin of 20 percent, the incremental production tax credits alone would have the equivalent bottom-line effect of an additional $2,000,000 in sales, the impact being larger as net profit margins decrease.
Given the returns on investment that optimization services can unlock, SgurrEnergy believes wind farm optimization will be increasingly important as the wind sector matures. And barring another wind drought, by December 2020 -- the 40th anniversary of the opening of the world’s first wind farm at Crotched Mountain in New Hampshire -- these tools could help America’s wind industry surpass the capacity factor of hydroelectricity, in a symbolic passing of the baton for the 21st century.
***
Jan Dell leads Wood Group’s business in the clean energy, water and climate sectors. She is a registered professional chemical engineer and the Convening Lead Author of the 2014 Energy Supply and Use Chapter of the U.S. National Climate Assessment Development and Advisory Committee report.
Matthew Klippenstein is a renewable energy consultant at SgurrEnergy, a division of Wood Group, where he evaluates the wind energy potential of prospective wind farms. A Canadian professional engineer, he has chronicled that country’s electric-vehicle market for Green Car Reports since 2013.


 41
41
 15
15
 9
9