The following article is adapted from GTM Research's recent report, Solar PV Balance of System (BOS) Markets: Technologies, Costs and Leading Companies, 2013-2016. To learn more about BOS markets in the U.S. and globally, click here.
As in other segments of the solar supply chain, cost reductions are a vital part of every player’s focus in the balance-of-system (BOS) market. The figure below illustrates the BOS cost breakdown for a 10-megawatt fixed-tilt, ground-mount project in the U.S. As can be seen, the largest cost component is labor, followed by the mounting structure and foundations (SBOS). Those two components account for 49 percent of the total BOS cost for the crystalline silicon (c-Si) system.
FIGURE: BOS Cost Breakdown 10 MW Fixed-tilt Projects in U.S., c-Si vs. CdTe
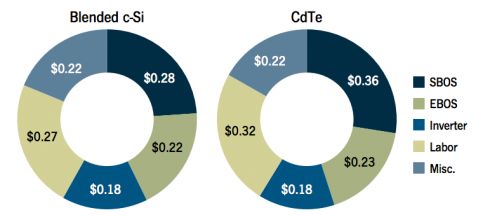
Note: The figure above assumes a thin-film project with 12.5 percent module efficiency and a multi c-Si project with 15 percent efficiency.
Source: Solar PV Balance of System (BOS) Markets: Technologies, Costs and Leading Companies, 2013-2016
In regards to BOS cost reduction, the U.S. market is one of the most critical and best-suited global markets for several reasons:
- Government investment: The U.S. Department of Energy’s SunShot Initiative aims to reduce the cost of solar power to $1 per watt by 2017. The Secretary of Energy has stated that the goal of SunShot is to subsidize technology development and drive down the cost of solar energy to release the burden of subsidization from the federal government through the ITC and other incentive programs.
- Market diversity: The U.S. is in essence 50 different solar markets due to the prevalence of state subsidy programs. This has befuddled most foreign market entrants because of the complexity and unique aspects of each state’s program, but it also provides the U.S. market with a slower overall growth pattern than a market with one blanket policy as in Italy or Germany. This levels the playing field a bit in terms of technology development; as BOS cost reductions improve overall costs in one market, another can take advantage of the improvements. Ultimately, this will help states determine accurate and sustainable pricing for new subsidy programs and relieve the burden of overpricing subsidies from the taxpayer and state programs.
- Climate diversity: The range of climates in the United States can allow technological advances, new products and new techniques to be validated in snowy as well as tropical settings. This will improve product bankability and allow the advances to be scaled worldwide more rapidly. Because of the lack of climate diversity in Germany, inverter manufacturers like Siemens and SMA suffered setbacks to their product development and reputations for reliability when they first started installing inverters in the markedly different climates of the Southwestern U.S.
- High labor costs: The U.S. has some of the highest labor costs in the world. Thus, stakeholders are deeply incentivized to develop products and best practices that reduce labor time and accelerate project delivery time. Emerging markets like China and India have very low labor costs and therefore less incentive to develop material and labor innovations that will reduce labor time.
- Less aggressive subsidy programs: U.S. policymakers have the luxury of learning from the rest of the global solar market’s failures in subsidy policy development. When subsidy rates are set too high, as in Ontario and some EU markets, innovations to reduce costs are less emphasized. Subsidy programs take significant resources to unwind their poor policy attributes after they are instilled, and their adaptations to more conservative but sustainable rates result in reduced investment by developers and manufacturers in the region. Clearly, the results of poorly structured programs are contrary to the intention of creating market growth. Programs in the U.S. are less aggressive. Feed-in tariffs are slow to catch on, and in some cases have been deemed illegal by utilities and state energy commissions tasked with developing programs. Consequently, to achieve success in this market, BOS cost reduction in the U.S. is more critical because there is less of a subsidy cushion to fall back on.
GTM Research's latest report on BOS markets forecasts costs to fall $0.07 per watt to $0.08 per watt per year from 2012 to 2016 (5.5 percent to 6 percent per year). It should be noted that GTM's forecast includes a margin of 11 percent to most accurately approximate the BOS costs currently seen in the market -- these could be captured by the EPC firm or in other parts of the value chain.
FIGURE: BOS Cost Roadmap, 10 MW Fixed-Tilt Blended c-Si Project in the U.S., 2012 to 2016
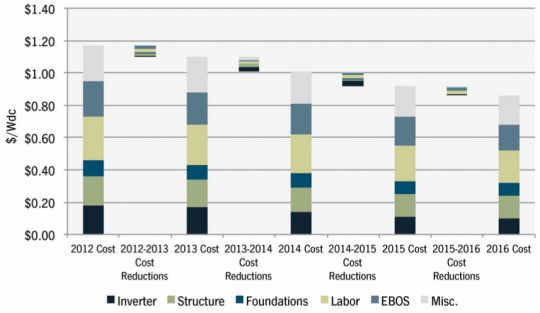
Source: Solar PV Balance of System (BOS) Markets: Technologies, Costs and Leading Companies, 2013-2016
The U.S. market is poised to assume a prominent role in BOS cost reduction over the next five years. Standard designs, new products and best practices that allow solar to be installed with manageable but not overstated profits will be developed in the U.S. and exported to new markets. This will create a global market less reliant on subsidies and more available for sustained and effective growth.
For more information on BOS technologies and market, visit www.greentechmedia.com/research/report/solar-pv-bos-2013.


 41
41
 15
15
 9
9