
A few weeks ago we discussed differences between solar "considerers" and solar adopters, highlighting the range of reasons that the majority of people who consider solar have yet to adopt it. The findings stemmed from a comprehensive study funded by the Department of Energy’s SunShot Initiative, led by the DOE’s National Renewable Energy Laboratory.
Among the key barriers to adoption are uncertainties around the costs and benefits of solar. Prospective customers often need extensive validation of the promises of rooftop solar, especially since it is a large investment and cannot be “test-driven” before signing.
Arguably, the best validation of the benefits of solar is a satisfied solar adopter -- part of the reason why referrals remain the most cost-effective means to acquire new customers. According to our survey of 1,662 solar adopters, most customers seem satisfied with both their solar power systems and their installers.
We conducted a net promoter score (NPS) analysis, which measures customer loyalty based on the relative percentages of solar “promoters” and “detractors” (dissatisfied customers).[1] We asked survey respondents: a) how likely they are to recommend solar panels and b) how likely they are to recommend their installers. We found that the average NPS for solar panels is 63 and the average NPS for solar installers is 52. A score of 50 or above is widely considered excellent (Figure 1). Rooftop solar seems to elicit high levels of satisfaction as compared to established consumer industries. Tracking customer satisfaction over time could provide interesting insight on whether those scores change and, if so, why.
Figure 1: Average Net Promoter Score for U.S. Consumer Sectors
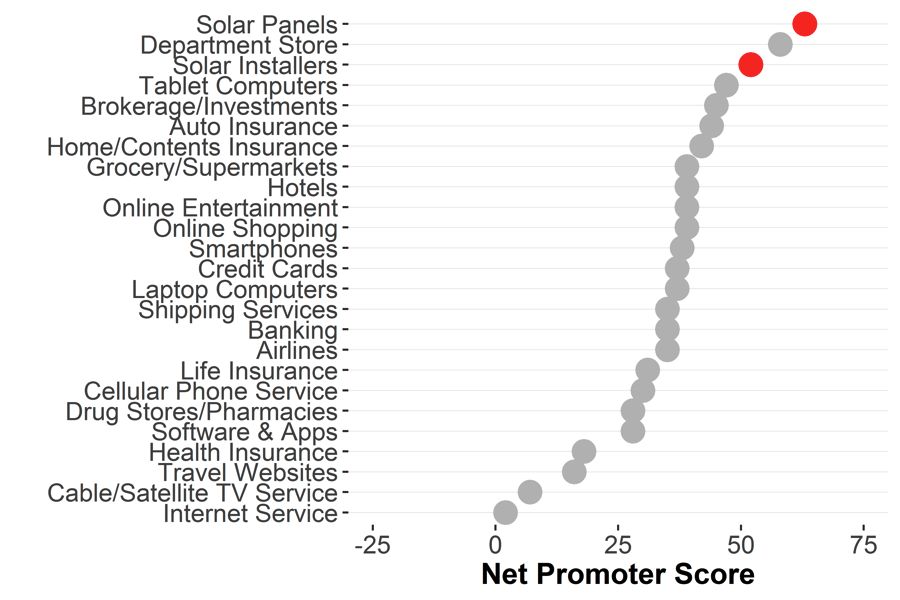
Source: 2016 Satmetrix Systems
However, customers were more likely to recommend solar panels than their installers by 9 percentage points, suggesting that there is room for improvement. The DOE study helps illuminate the factors influencing customer satisfaction with rooftop solar, insights that may prove helpful as the industry grows and matures.
Finding No. 1: Minimal demographic differences between promoters and detractors
Solar promoters and detractors are, demographically, very similar (Figure 2). Promoters tend to be more financially comfortable, educated and left-leaning, yet the differences are minimal, suggesting that customer satisfaction is more about the customer experience or attitudinal factors than customer demographics.
Figure 2: Select Characteristics of Solar Non-Promoters and Promoters
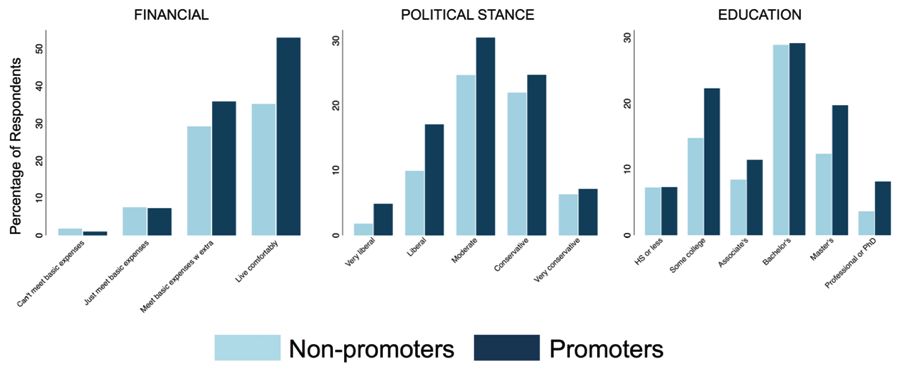
Note: Percentages exclude missing and ‘don’t know’ responses
Finding No. 2: Promoters tend to place more value on non-monetary benefits of solar
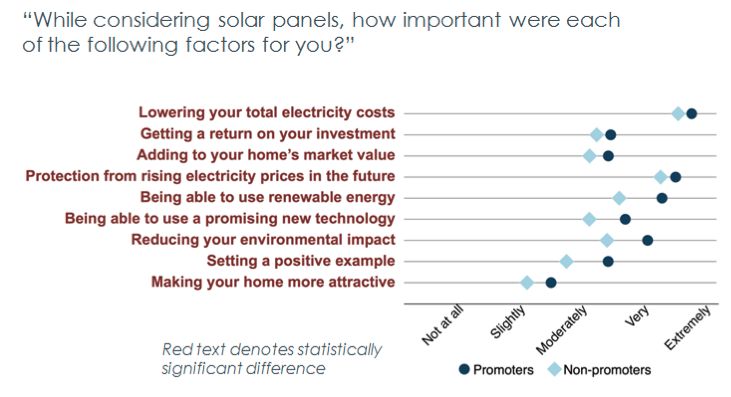
While all customers were at least partially motivated by saving money, promoters seemed more motivated by non-economic reasons (Figure 3). They were about 19 percent more likely to report that using renewable energy was a very important factor in their decision to go solar. It is plausible that realizing these additional, non-financial rewards might have boosted the satisfaction of going solar.
Figure 3: How Different Factors Influence Customers’ Consideration of Rooftop Solar
Finding No. 3: Promoters and detractors encountered similar difficulties, but promoters had better experiences
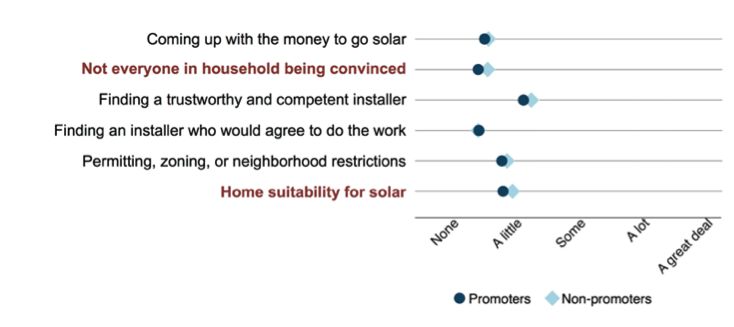
Overall, both promoters and non-promoters faced only slight challenges with the potential difficulties we asked about (Figure 4). Promoters and detractors, essentially, had the same type of difficulties in going solar -- finding the right installer, reaching household consensus, having a home suitable for solar, etc. Promoters reported slightly lower levels of difficulty across the board.
Figure 4: Difficulties Customers Encountered in Going Solar
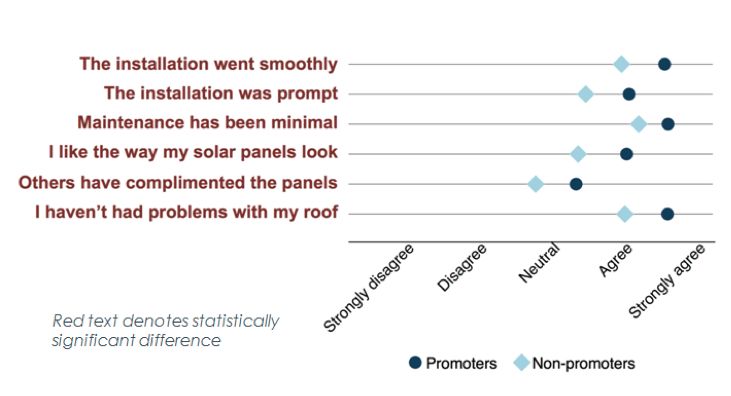
Despite facing similar difficulties, promoters had a significantly better experience during and after the solar installation across each of metrics we evaluated (Figure 5). To be sure, non-promoters generally had a good experience, with most agreeing or strongly agreeing that their “installation went smoothly” or that they “haven’t had problems” with their roof, though they were less happy with the appearance of the systems and how quickly the installation occurred.
Figure 5: Customers’ Experience During and After a Solar Installation
Finding No. 4: Promoters’ actual savings better matched expectations
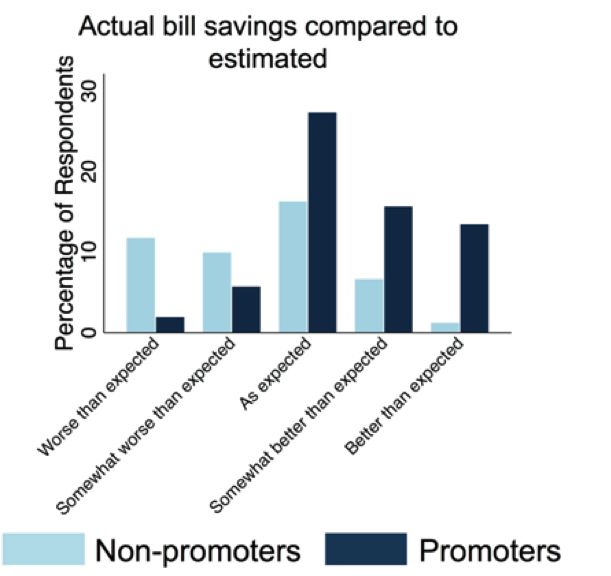
The biggest factor influencing satisfaction is whether or not customers felt they got the economic savings they expected (Figure 6). Satisfied customers were about 18 percent more likely to report that the economic performance of their system met or exceeded their expectations. Intuitively, this makes sense, because economic considerations were the primary drivers customers reported in having influenced their decision to go solar (Figure 3). Customer dissatisfaction is common when products or services under-deliver on the benefits customers want the most. What is unclear is whether satisfaction was driven more by objectively meaningful savings or by installers properly setting savings expectations, which could be the subject of future research.
Figure 6: Customers’ Perception of Actual Savings Relative to Their Expectations
Finding No. 5: Overpromising may drive dissatisfaction
Nearly 9 percent of all customers surveyed expressed some regrets about going solar. Common regrets included: not achieving anticipated savings, leasing systems instead of buying, not shopping around for other installers, and learning that the solar array didn’t work during blackouts. Non-promoters were 30 percent more likely to have reported that their interest in solar was prompted by an installer approaching them. These data points suggest that one source of dissatisfaction could have been that customers felt oversold on solar. Promoters were 15 percent more likely to have talked to more than one solar installer. This doesn't necessarily mean that those who shopped around got better deals. Rather, it's possible that the mere act of talking to multiple installers provided these customers more confidence in their purchase decision.
Finding No. 6: Most solar customers are referring their friends
A whopping 80 percent of respondents made a referral, and the median number of referrals they provided was three. And of those who expressed regrets about solar (see previous finding), 35 percent were still solar promoters. That is, the overall solar experience seemed positive enough for them to overlook whatever disappointment they encountered.
Implications for installers and the industry
Overall, the survey showed that most adopters are happy with their adoption decision. Net promoter scores show that people are pleased with solar, mostly pleased with their installers, and willing to recommend both to others. However, there are some notable discrepancies between promoters and non-promoters, many of which appear to be specific to installers, rather than solar as a technology. One of the goals of this DOE study was to identify ways to improve the customer experience. Based on the above findings, we’ve developed the following recommendations:
- Set appropriate expectations. Customer satisfaction doesn’t depend as much on great performance as it does on performing to expectations. For instance, Southwest Airlines delivers a relatively bare-bones flight experience, but routinely ranks among the top airlines in customer satisfaction because it tells customers what to expect and consistently delivers on those expectations. While both promoters and non-promoters sought good returns on their solar investment, the resulting economic savings generally exceeded promoters’ expectations but fell short of detractors’ expectations. Thus it is essential that you set clear, realistic expectations with customers from the outset. Otherwise, you’ll end up with disappointed or angry customers, which can lead to lost referrals or harmful online reviews.
- Tighten your operations. As we discussed in Part I of this series, early adopters of innovations tend to be trendsetters, while later adopters are more guided by pragmatism. Rooftop solar’s current penetration is less than 1 percent, so we assume that the solar customers we surveyed skewed toward early adopters. We suspect that these customers may be more forgiving than typical customers when challenges arise. The survey results seem to support this, as promoters value non-monetary benefits of solar more than non-promoters, and had a better sales experience. If we are correct, we can expect future solar customers to be more critical and less patient. Correctly setting expectations and running cleaner operations (scheduling crews more precisely, responding to customers more quickly, reducing change orders and errors, etc.) could help keep customer satisfaction scores and corresponding referral rates high.
- Be comfortable with customers shopping around. Solar adopters who began their purchase journey by being approached by an installer seem less happy with their experience than adopters who initiated the purchase journey themselves. Additionally, a number of respondents expressed satisfaction with their systems but regretted not shopping around for different products or installers. Together, these findings may indicate that it's time to ditch so-called "one-call close" techniques where salespeople sign customers on the spot in favor of a long game that produces customers who are more satisfied and thus more likely to provide coveted referrals.
- Provide simple ways for customers to be your advocate. Our survey results indicate that 80 percent of solar adopters are willing to make referrals. This can be valuable. Customer acquisition costs typically run at $2,000 or more. Referrals drop that cost to $500 or less. Customers have busy lives, and selling solar is not their job, much less a priority. Making it easy for the willing to provide referrals in ways that they are comfortable can help bring lower-cost customers into the sales funnel. Customers may be willing to place a small sign in their lawn, provide a testimonial on social media, serve as a reference for others in their neighborhood, or host a solar party. Creatively engaging satisfied customers, and keeping them satisfied over time, can potentially lower customer acquisition costs. Additionally, it’s worth checking in with existing customers from time to time, especially the long-time ones who can attest to the long-term solar experience.
- Think big. John F. Kennedy liked to say that a rising tide lifts all boats. Actions to improve the quality and reputation of the industry can similarly help the solar industry as a whole. For example, steps to standardize or streamline permitting and interconnection requirements, to reduce uncertainty about rate structures, or to encourage adoption of industry standard practices can help facilitate adoption of solar in broader, more risk-averse market segments. Regional or national industry associations provide one potential vehicle for such action.
[1] Satisfaction was evaluated via “How likely are you to recommend [solar panels/your solar installer] to a friend or neighbor?”, where responses ranged from “1 = Not at all likely” to “11 = Extremely likely”. Promoters are defined as responses of 10 or 11, and detractors are defined as responses of 7 or less. The NPS score is calculated as NPS = percentage promoters minus percentage detractors
***
The authors are James Tong (CEO, Advanced Grid Consulting), Ben Sigrin (Energy Systems Modeling Engineer, NREL), Eric O'Shaughnessy (Renewable Energy Policy Analyst, NREL), and Alison Mickey (Sr. Dir. Corporate Comms, Spruce Finance).
Project contributors included: Lawrence Berkeley National Lab, National Renewable Energy Lab, Portland State University, Social and Environmental Research Institute, Spruce Finance, University of Arizona and University of Michigan.


 41
41
 15
15
 9
9