
Last year, the Solar Foundation issued a census of the solar industry showing 119,016 jobs spread around the country. Today the organization has updated that resource with an interactive map detailing where around the country those solar jobs are located.
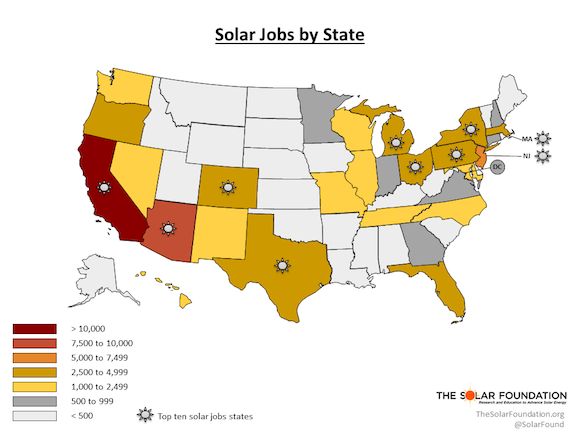
The geographic results aren't a big surprise (e.g., 43,000 solar jobs in California vs. 50 solar jobs in Wyoming) and probably aren't all that helpful for anyone who already knows a little bit about solar. But the map combines the jobs data with a variety of other pieces of information on the number of companies operating, employment subsectors, solar resources, state targets, interconnection scores and electricity prices.
There are three obvious takeaways that the resource illustrates: Installation and project development jobs are by far the most dominant in solar; states with strong policies rank highest in numbers of jobs and businesses operating; and strong solar resources don't necessarily mean big employment numbers.
There are some surprises, too: "In comparing our estimates with data from the Bureau of Labor Statistics, we find that California now has more solar workers than actors and that there are more solar jobs in Texas than there are ranchers," said Andrea Luecke, executive director of the Solar Foundation.
The U.S. solar industry installed 90,000 solar systems last year, bringing 3,313 megawatts of capacity on-line, according to GTM Research and the Solar Energy Industries Association. That growth in installations boosted solar employment by 13.2 percent.
So where are the jobs? Click on the map below to peruse the resource. It's a pretty decent resource for finding quick facts on solar employment and the underlying drivers. (And on a related note, the Solar Electric Power Association ranked its top utilities in solar, so you can check out that resource here.)


 41
41
 15
15
 9
9