
Every quarter, GTM Research’s grid edge analysts compile the most important data and findings from the past three months for Grid Edge Executive Council members. The most important charts from the Q3 2015 Grid Edge Executive Briefing cover venture capital, microgrids, AMI deployments, analytics and energy storage.
Baseline grid-edge venture capital and private equity grew to $687 million in 2015*
Excluding the largest two deals from each year, grid-edge venture capital and private equity grew slightly in 2015, compared to the same period in 2014. Energy storage received the largest share of investment, netting $284 million from January to November 2015.

Source: GTM Research Grid Edge Corporate Activities Tracker
*December excluded as data was not yet finalized
Annual spending in the U.S. microgrid market will exceed $829 million in 2020
The aggregated market potential over 2015-2020 is forecasted to be more than $3.5 billion, with the bulk of investments predicted to be allocated to new generation, followed by distributed grid enhancements.
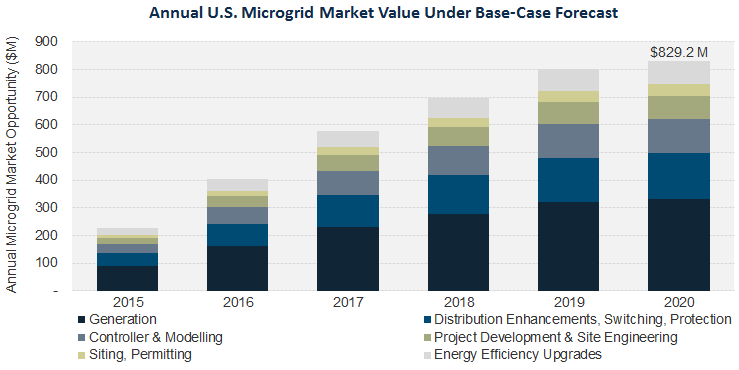
Source: GTM Research
U.S. surpassed 100 MW of annual installed storage in Q3 2015
According to the most recent U.S. Energy Storage Monitor report, the U.S. deployed 60.3 megawatts (53 megawatt-hours) of storage in the third quarter of 2015.

Source: GTM Research Q3 2015 Energy Storage Monitor
The United States installed 5.2 million smart electric meters in 2014
The 2014 update of EIA Form 861 reported that the U.S. installed 5.2 million AMI electric meters in 2014, bringing the cumulative number to 58.5 million meters. Through 2014, overall AMI penetration is now 41 percent.

Source: EIA, GTM Research's research note "State of U.S. AMI Deployment"
34 U.S. utilities signed up for volt/VAR control software in 2015
Utilities continue to ramp up software capabilities to enable conservation voltage reduction and improve renewables integration. Full roll-outs continue to flourish among smaller municipal and cooperative utilities, while several IOUs contracted pilots.

Source: GTM Research Grid Edge Deployment Tracker
Energy reductions from economic demand response fell by 17.6% in 2015*
Economic demand response energy reductions from January through October of 2015 totaled 104 gigawatt-hours. Compared to the same period in previous years, 2015 saw 17.6 percent and 11.6 percent less reduction versus 2014 and 2013, respectively.

Source: PJM
(*November and December excluded as data had yet to be finalized)
***
Grid Edge Executive Council members receive quarterly slide-based market briefings from the grid edge analyst team. For more information on the Grid Edge Executive Council, download the brochure here or contact Tate Ishimuro at [email protected]


 41
41
 15
15
 9
9