Following up on Part One of our series on thin-film PV based on GTM Research's Thin Film 2012–2016 report, we take a more incisive look at the manufacturing and competitiveness of thin film, as well as the levers suppliers can use to drive down costs.
In order to understand the competitive dynamics between crystalline silicon (c-Si) and thin-film PV, we must first look at the staple of PV market competitiveness: manufacturing costs. In the figures below, we break down the typical cost structures for a leading Chinese multicrystalline silicon PV module manufacturer and our estimates for First Solar’s Malaysia facility running at full utilization in 2012. Although overall costs are dissimilar, the cost of the multicrystalline silicon comes to about $0.82/W versus just $0.63/W for First Solar (not including stock-based compensation, warranty, and recycling). These examples serve as a benchmark for cost-structure comparisons of mature facilities.
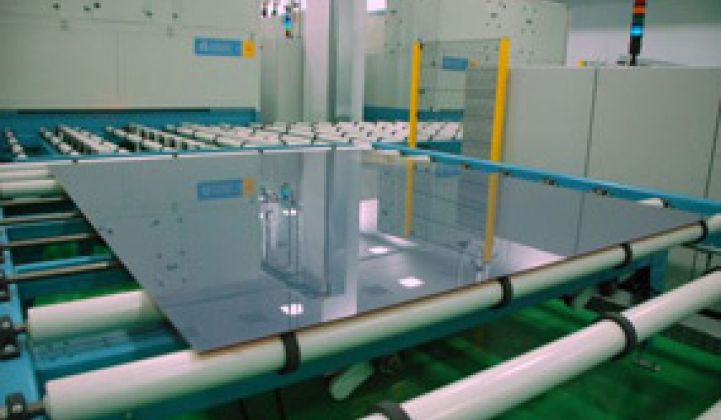
FIGURE: Chinese c-Si Module vs. First Solar CdTe Module (Malaysia), 2012E
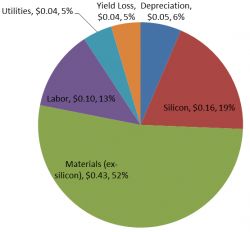
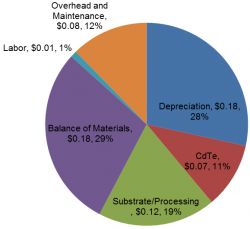
Source: Thin Film 2012-2016: Technologies, Markets, and Strategies for Survival (GTM Research)
As exhibited in the cost breakdowns, raw materials for c-Si PV amount to 72 percent of the total cost structure, with polysilicon as the single largest contributor to underlying costs. In contrast, CdTe feedstock contributes only 10 percent to the total cost structure of a CdTe panel, which underscores thin film’s limited dependency on a potentially volatile commodity metals markets. For CIGS and thin-film silicon, this cost component can be less than 10 percent of the total cost of the module. This advantage, however, can be a double-edge sword; the cost structures provide a large incentive for c-Si manufacturers to reduce silicon costs and usage, whereas thin film suppliers remain dependent on commodity material costs like glass, edge sealants, and junction boxes.
Without a dramatic lowering of raw material costs on the horizon, thin film manufacturers will have to rely on other levers to reduce costs. Efficiency is the most obvious, and improvements provide a two-fold benefit: efficiency gains reduce material costs on a per-watt basis and reduce the balance-of-systems penalty suffered by low-efficiency products.
2011 was full of record efficiency announcements, including First Solar’s CdTe record cell at 17.3 percent, Solar Frontier’s 17.8 percent submodule aperture-area efficiency, and SoloPower’s flexible module aperture-area efficiency of 13.4 percent. Understandably, these announcements do not represent commercially available technologies; the actual best commercially available module efficiencies are much lower. However, the record efficiency announcements are a promising indication that high-efficiency thin film products could be available in the next few years.
FIGURE: Record vs. Average Annual Efficiencies by Technology
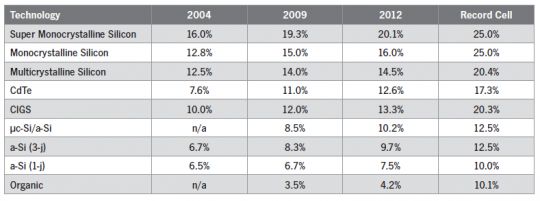
Source: Thin Film 2012-2016: Technologies, Markets, and Strategies for Survival (GTM Research)
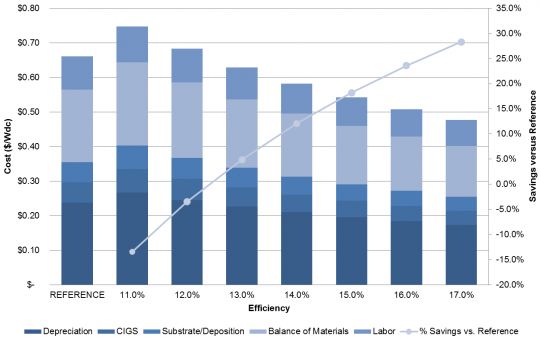
But to what degree can efficiency bridge the gap between thin film and c-Si PV manufacturing costs? The answer varies depending on manufacturing process and technology, but generalizing a fully utilized reference 500-megawatt CIGS manufacturing facility based in the U.S., Europe or Japan producing a 12.5-percent-efficient CIGS module, we find that, unsurprisingly, efficiency can lead to significant savings across the cost structure. Assuming that the capex is the same and efficiency tweaks come only from minor changes in process that do not affect uptimes and yields, we isolate the effect of efficiency on CIGS module manufacturing in the following figure.
A 0.5 percent absolute gain in module efficiency (from 12.5 percent to 13.0 percent) nets a 5 percent savings in module manufacturing costs. However, the benefits decay as manufacturers push efficiencies higher. For example, while pushing from a 12.5-percent to a 14-percent efficient product saves approximately 12.1 percent in module manufacturing costs, the savings-per-percent-efficiency is only 8 percent, as opposed to the 10 percent we saw moving from 12.5 percent to 13.0 percent.
In absolute terms, a module manufacturer pushing from 12.5 percent efficiency to 14.0 percent efficiency nets a $0.10 per watt savings. GTM Research estimates that actual fully loaded costs for a leading CIGS manufacturer in 2012 could be as low as $0.89 per watt dc (note that this reflects underutilization). Thus, a $0.10 per watt dc savings could pull CIGS manufacturing costs below estimated c-Si manufacturing costs. This CIGS manufacturer would still have to sell at more than the $0.03 per watt difference (vs. our 14.5 percent, $0.82 per watt dc Chinese c-Si reference) to account for the efficiency discrepancy between CIGS and c-Si. Nevertheless, manufacturing high-efficiency thin film is a key factor toward competitiveness, especially at the lower end of the efficiency spectrum.
FIGURE: CIGS Costs vs. Efficiency for 500-Megawatt Plant in Europe/North America/Japan
Source: Thin Film 2012-2016: Technologies, Markets, and Strategies for Survival (GTM Research)
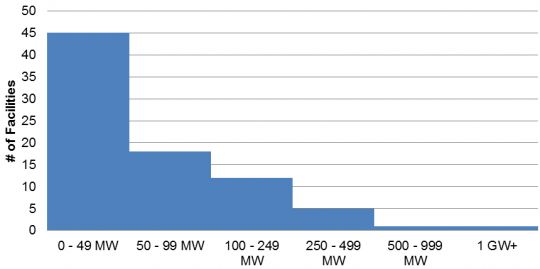
Yet efficiency isn’t the only lever for thin film manufacturers to capitalize on to triumph over c-Si PV. Other levers available to thin film manufacturers include process yields, throughput/uptime, and the always-important scale. According to a 2009 publication by the Boston Consulting Group study, quadrupling scale from 100 megawatts to 400 megawatts can create a 15 percent to 25 percent, 20 percent to 30 percent, and <10 percent drop in production costs in c-Si wafer, cell, and module costs, respectively. These reduction estimates don’t necessarily translate to thin film, but they do provide a basis for the range of scale improvements that can be expected from module manufacturing, regardless of technology. Based on industry channel checks, we model an upper limit of 10 percent decreases in cost for the doubling of production capacity, which means that the benefits of scale begin to peter out after the one- to two-gigawatt mark. Given that 90 percent of thin film facilities are smaller than 250 megawatts, thin film manufacturing still has a lot of room to grow -- if (and that’s a big 'if') the demand market and current oversupply environment has room for it.
FIGURE: Thin Film Facilities by Production Capacity, Year-End 2011
Source: Thin Film 2012-2016: Technologies, Markets, and Strategies for Survival (GTM Research)
To that last point, blind expansion is not a wise move in the current environment. Even with industry-leading costs and a strong captive pipeline to absorb demand, First Solar still expects utilization rates could drop to 85 percent on the year. While that’s not to say other thin film manufacturers won’t find a secret sauce unobtained by First Solar (e.g., access to significant Chinese or Japanese downstream pipeline), it does call into question announcements by thin film manufacturers like Hanergy that targeting gigawatts of production capacity by year's end (but in fairness, we were skeptical about Solar Frontier's desire to immediately scale from just 80 megawatts to 980 megawatts, too). Growing too quickly will result in significant underutilization, which greatly affects the fully loaded costs (i.e., costs including depreciation) of PV modules.
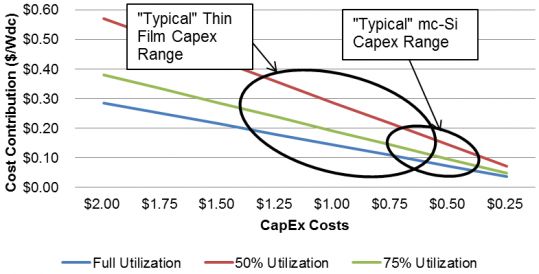
Whereas depreciation of c-Si capital equipment amounts to only 6 percent to 10 percent of module costs, it can account for a quarter of even a fully utilized thin film manufacturer’s costs. A large supply chain of commodity manufacturing equipment for c-Si has allowed equipment costs to come down dramatically. With current global producible capacity of c-Si PV modules above 31 gigawatts, utilization rates have fallen dramatically. However, the actual effect of low utilization on costs is limited by the relatively low capex for c-Si manufacturing. Contrast this to thin film manufacturing, where capex can easily approach and even exceed $1 per watt. Only industry-leading capex for capital equipment (minus building and facility upgrades) brush against multicrystalline silicon capex costs. While demand markets are still sorting themselves out, expansion of scale to reduce costs may only increase cash burn while crystalline competitors continue to push product at razor-thin and even negative margins.
FIGURE: Capex Costs' Effect on Module Costs, 2012
Source: Thin Film 2012-2016: Technologies, Markets, and Strategies for Survival (GTM Research)
Looking at thin film cost structures, the road for thin film competitiveness continues to be an uphill struggle. However, in the next and final part of this series, we will explore how changing market dynamics and a maturing understanding of thin film performance will ultimately drive thin film competitiveness and the long-term success of leading players.


 41
41
 15
15
 9
9