Admit it. You're a little baffled. We all are.
Each quarter in the solar industry is like a new plot twist in a David Lynch movie. It feels a little hard to discern reality.
Lucky for you, we've got spoilers. Or at least we can see how the script is being written in real time, thanks to our team of analysts.
Since we're now heading into the second half of 2017 -- already a surreal year -- I've compiled some of the best charts from GTM Research's solar team that help explain the story unfolding in real time.
And remember, you can find all these reports in their entirety in the GTM Research vaults.
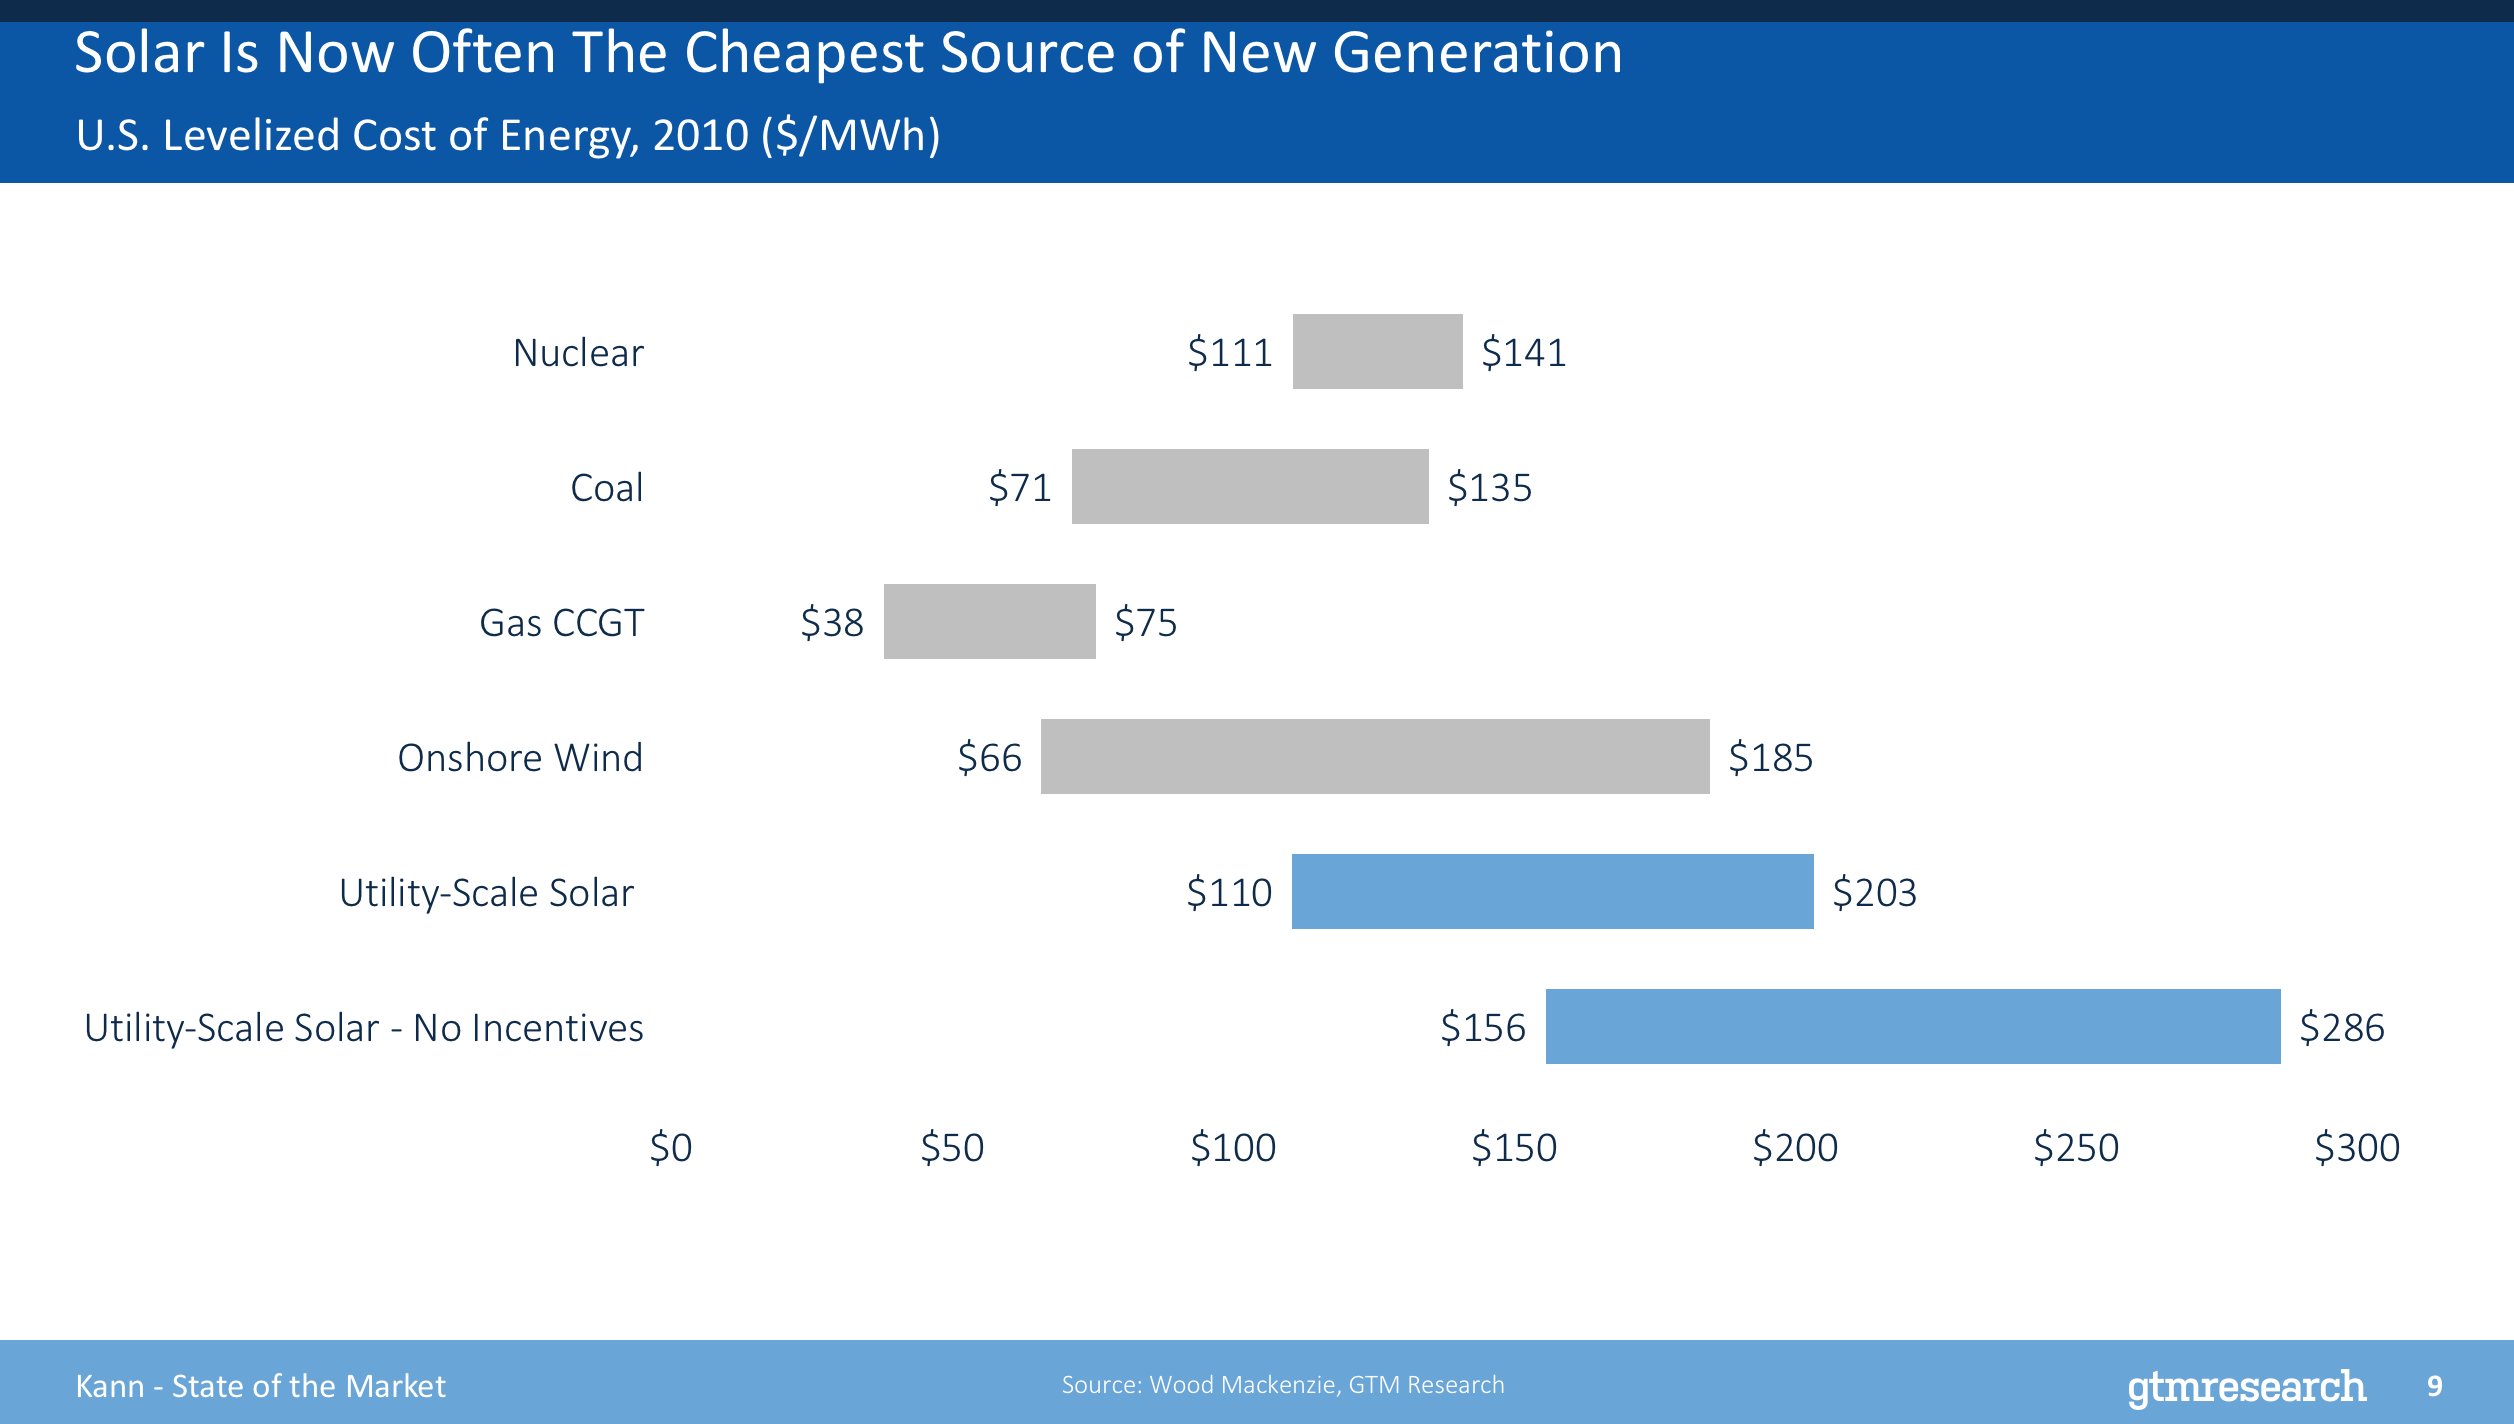
Solar PPAs: The natural-gas "bridge" has been crossed
Natural gas has always been seen as a "bridge fuel." Well, in many markets, solar has finally made it over the bridge. PPA prices are regularly coming in at 5 cents per kilowatt-hour or less, making it the cheapest source of new generation.
This chart comes from Cory Honeyman, the associate director of GTM Research's solar practice. He gave a presentation on the state of U.S. solar at our Solar Summit. (Watch it here.)

A wake-up call for utilities
As a result of the ongoing price declines, in a growing number of utility integrated resource plans, solar is modeled as the lowest-cost resource, hands down.
If these utilities were focused only on cost-per-kilowatt-hour, they would be building nothing but solar over the coming decades.
Shayle Kann, the head of GTM Research, explained what's happening at Dominion Energy: "If you look at the 2016 Integrated Resource Plan, they were already planning to build out a bunch of solar in their territory in the next 15 years or so. But just a couple of weeks ago, they submitted their 2017 IRP -- just one year later, running similar models -- and the amount of solar more than quadrupled."
...And a lot more utilities are about to wake up, too
Under a business-as-usual scenario (assuming Suniva, SolarWorld and Trump don't blow up the industry together) system prices are going to fall by another 31 percent from this year until 2022.
Utility system prices are already hovering around $1 per watt in most markets, and will consistently come in below $1 per watt next year. We'll see the same thing globally as well.
This outlook comes from Solar Analyst Ben Gallagher's new PV system pricing breakdown and forecast.

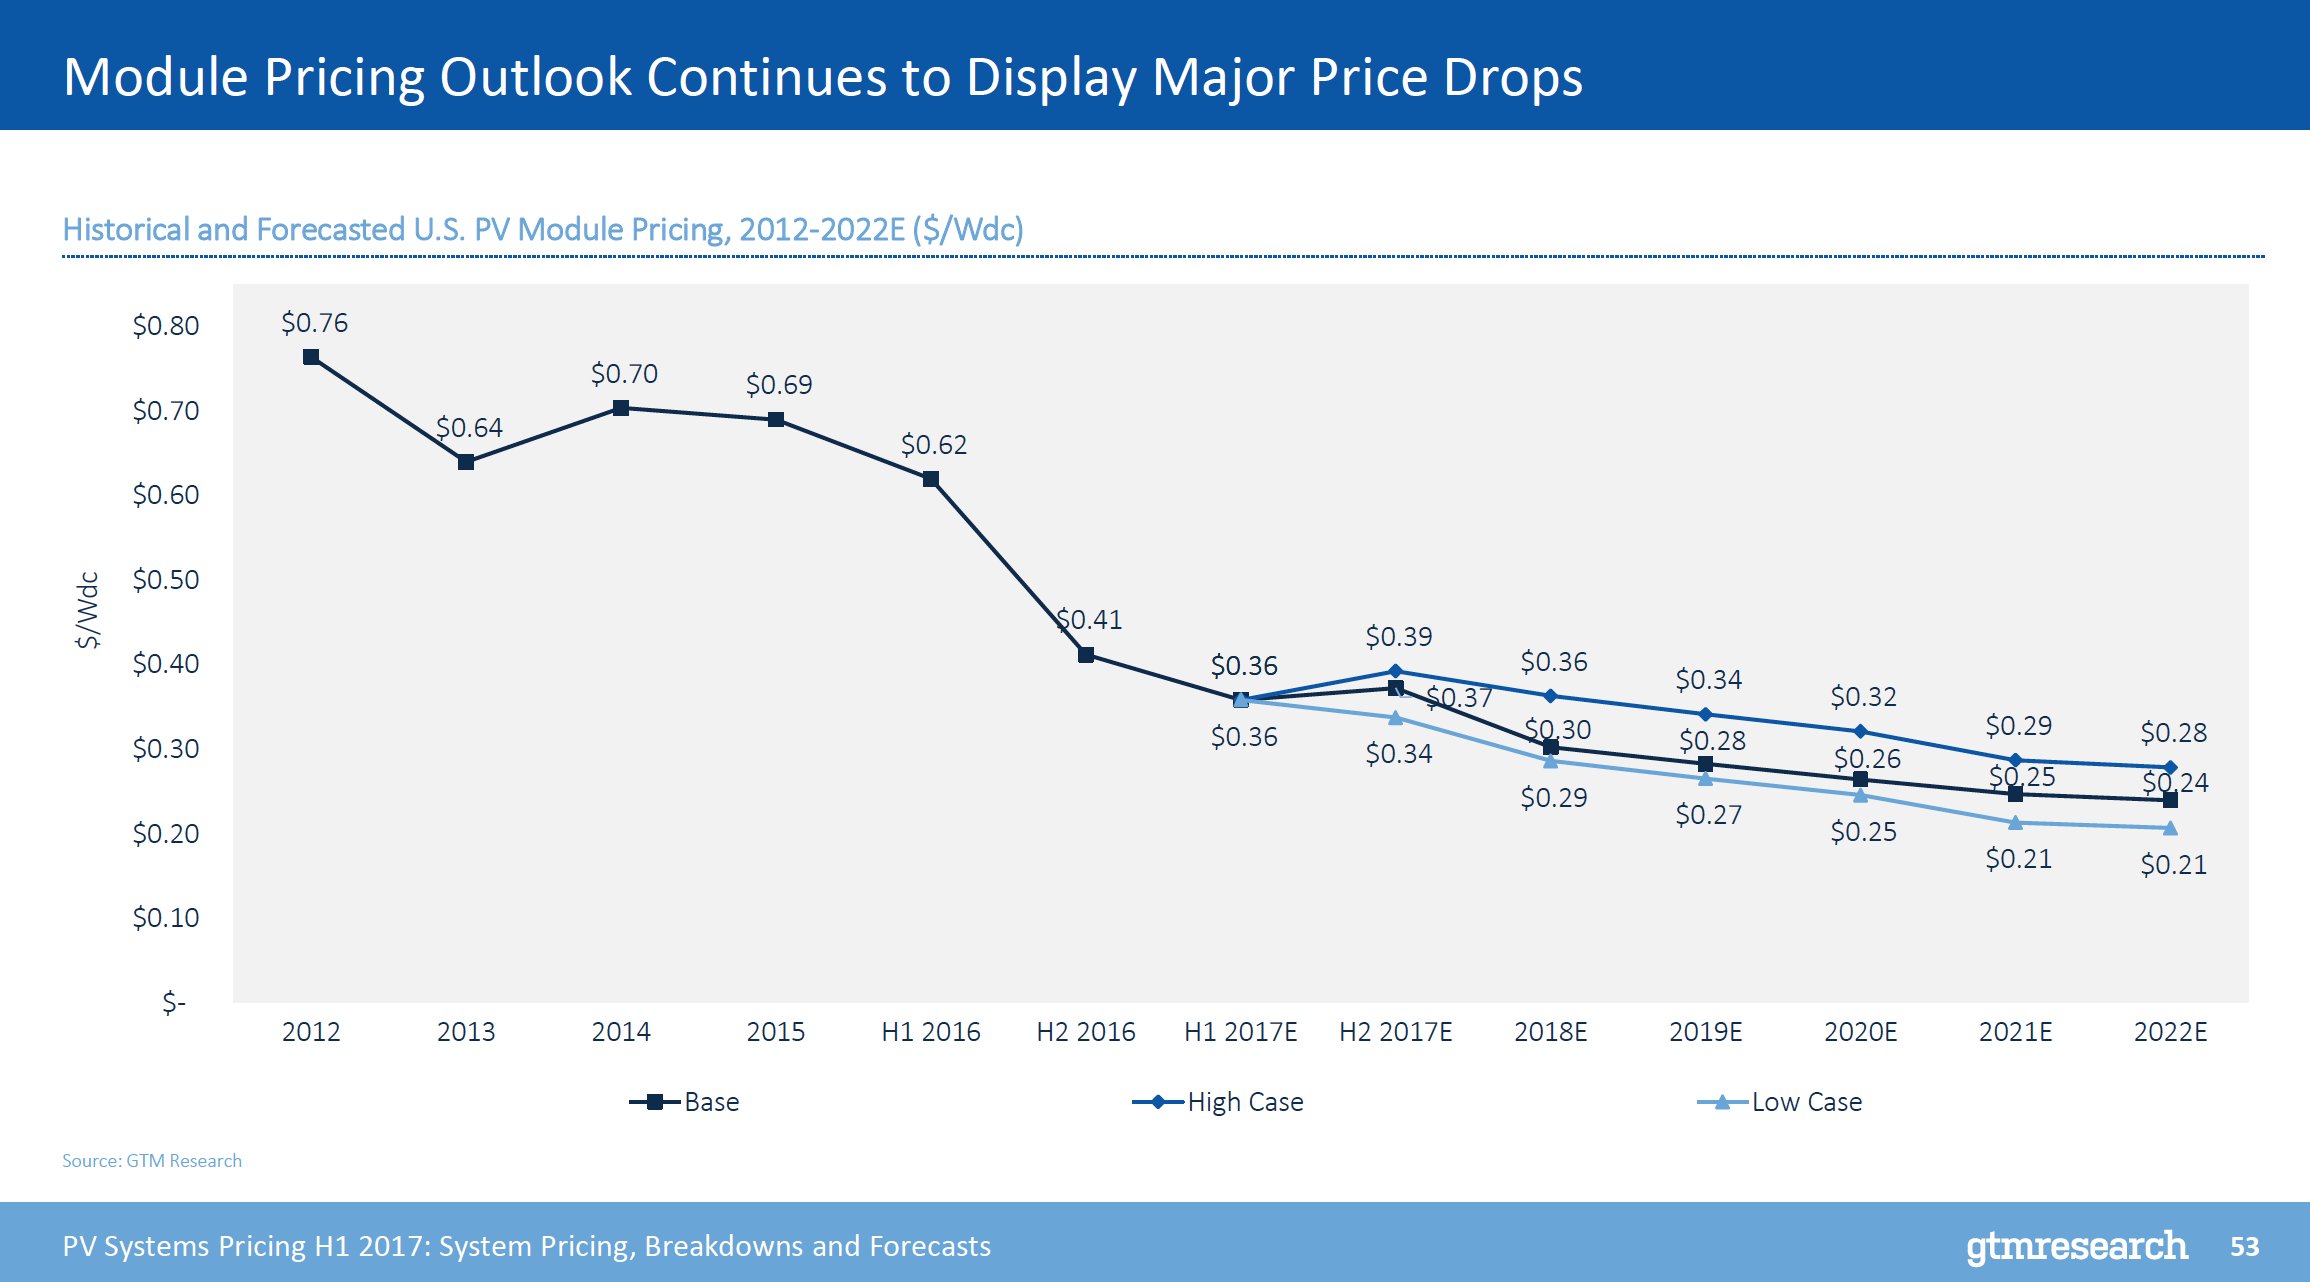
Thanks, module oversupply
Global solar prices fell nearly 40 percent last year because of oversupply, mostly in the second half of the year. As Gallagher maps out, American developers and installers will continue to benefit from declining module prices in the coming years.
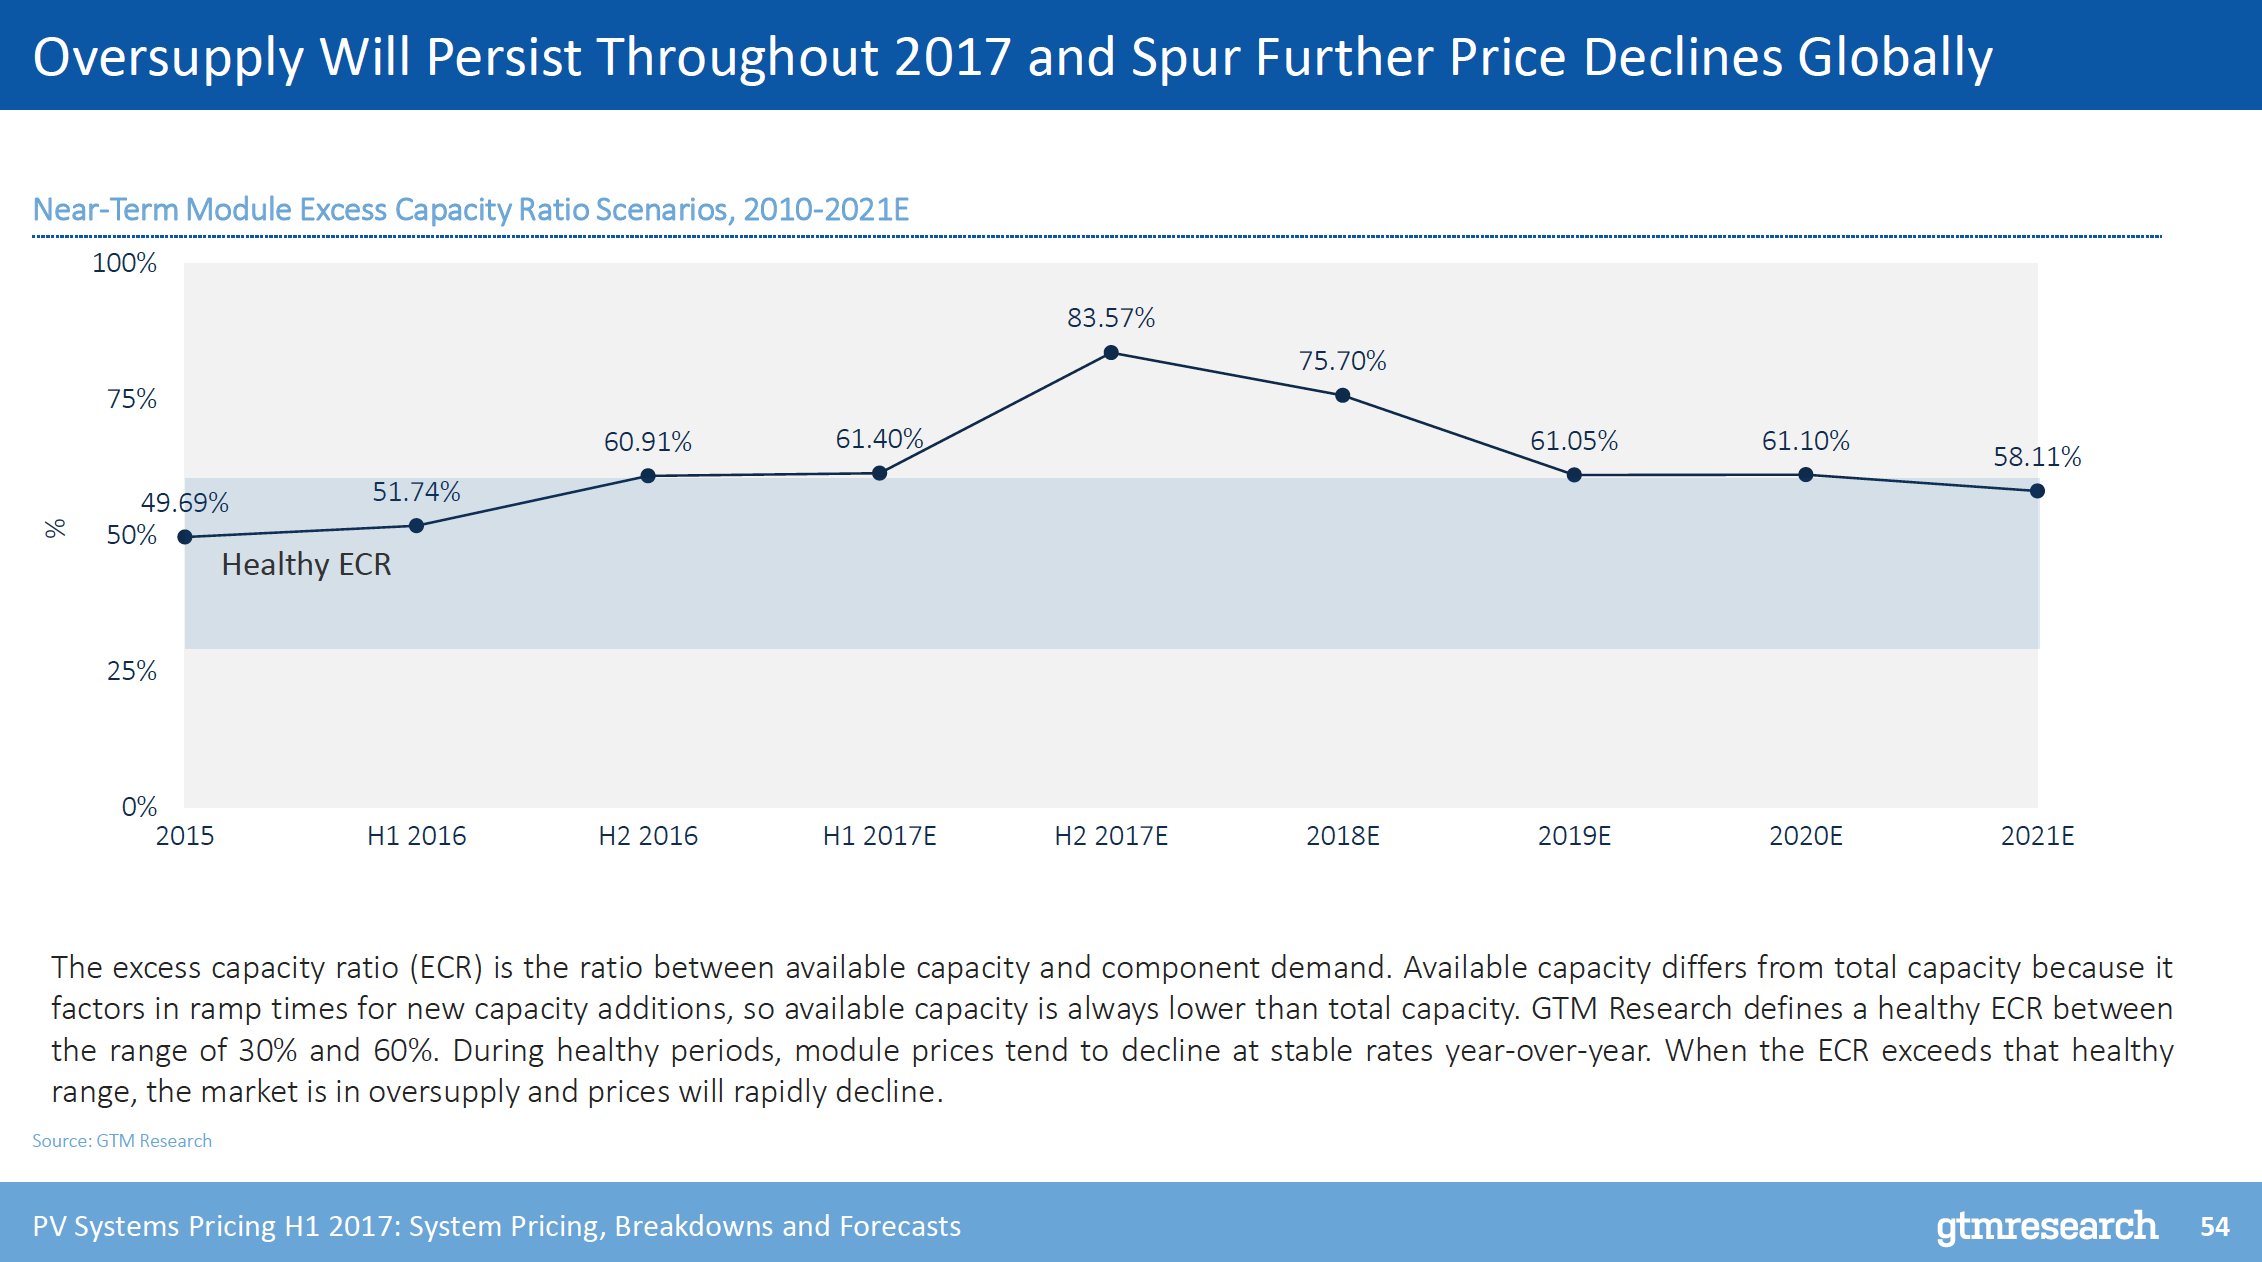
Wait -- no thanks, module oversupply
This is not a good time to be a solar manufacturer. The last nine months have forced top producers to restructure and prepare for a long period of pricing pressure.
It's also put American-based manufacturers on the ropes. That includes Suniva (bankrupt) and SolarWorld (insolvent), which have filed a controversial trade complaint with the government over imports of solar cells and modules.
Indeed, the "excess capacity ratio" mapped by GTM Research's Gallagher doesn't look good for producers anywhere in the world.
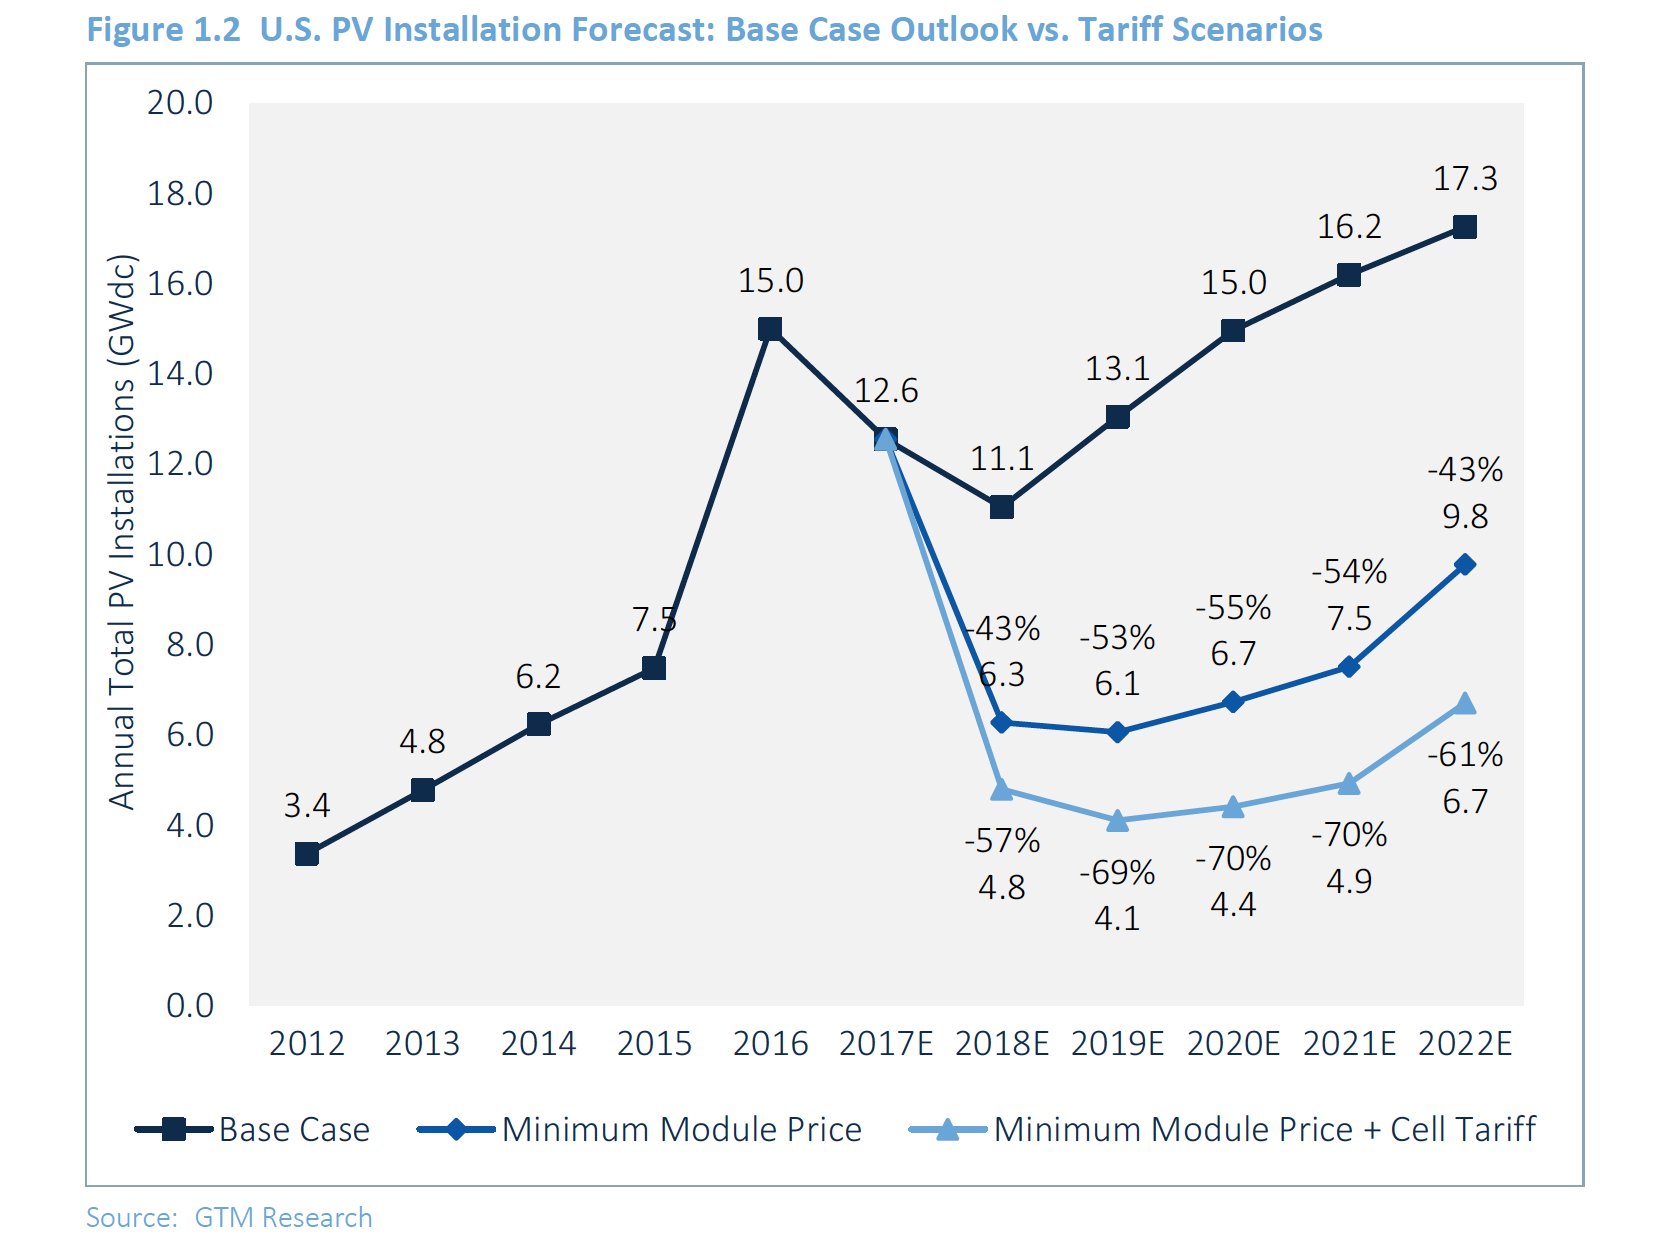
But all the positive trends you just read about could get turned upside down
So what happens if Suniva and SolarWorld get their way and the government slaps tariffs and minimum prices on imported solar equipment? The whole market would change.
(We've covered the background of the trade case extensively. If you're not up on the details, I suggest reading the transcript of our Interchange episode on the matter. Or simply listen to the podcast.)
Cory Honeyman has been feeding the GTM Research supercomputer, trying to figure out what pricing and demand would look like under 40-cent-per-watt tariffs on cells and a floor price of 78 cents for modules. If those two actions are stacked together, as Suniva has requested, we could see U.S. installations drop by 61 percent compared to the base forecast -- a difference of about 10 gigawatts in yearly installs.
Protect ya neck: Trade protectionism is the norm in solar
America's current trade case might be the most extreme. But many other countries are also looking to protect their domestic solar production.
Benjamin Attia, a solar analyst with GTM Research's global team, has been sifting through solar trade policies. He found that nearly 40 percent of global demand for solar is subject to tariffs or domestic content requirements.
What's the reason for all these protectionist policies? As Trump might say: "CHI-NA."
"Most trade cases are tied to Chinese exports and have shifted the balance of trade away from Chinese manufacturing toward Southeast Asian, Taiwan and Korean production capacity to circumvent tariffs and keep components duty-free and competitive," writes Attia.
Don't forget about inverter producers -- they're hurting, too
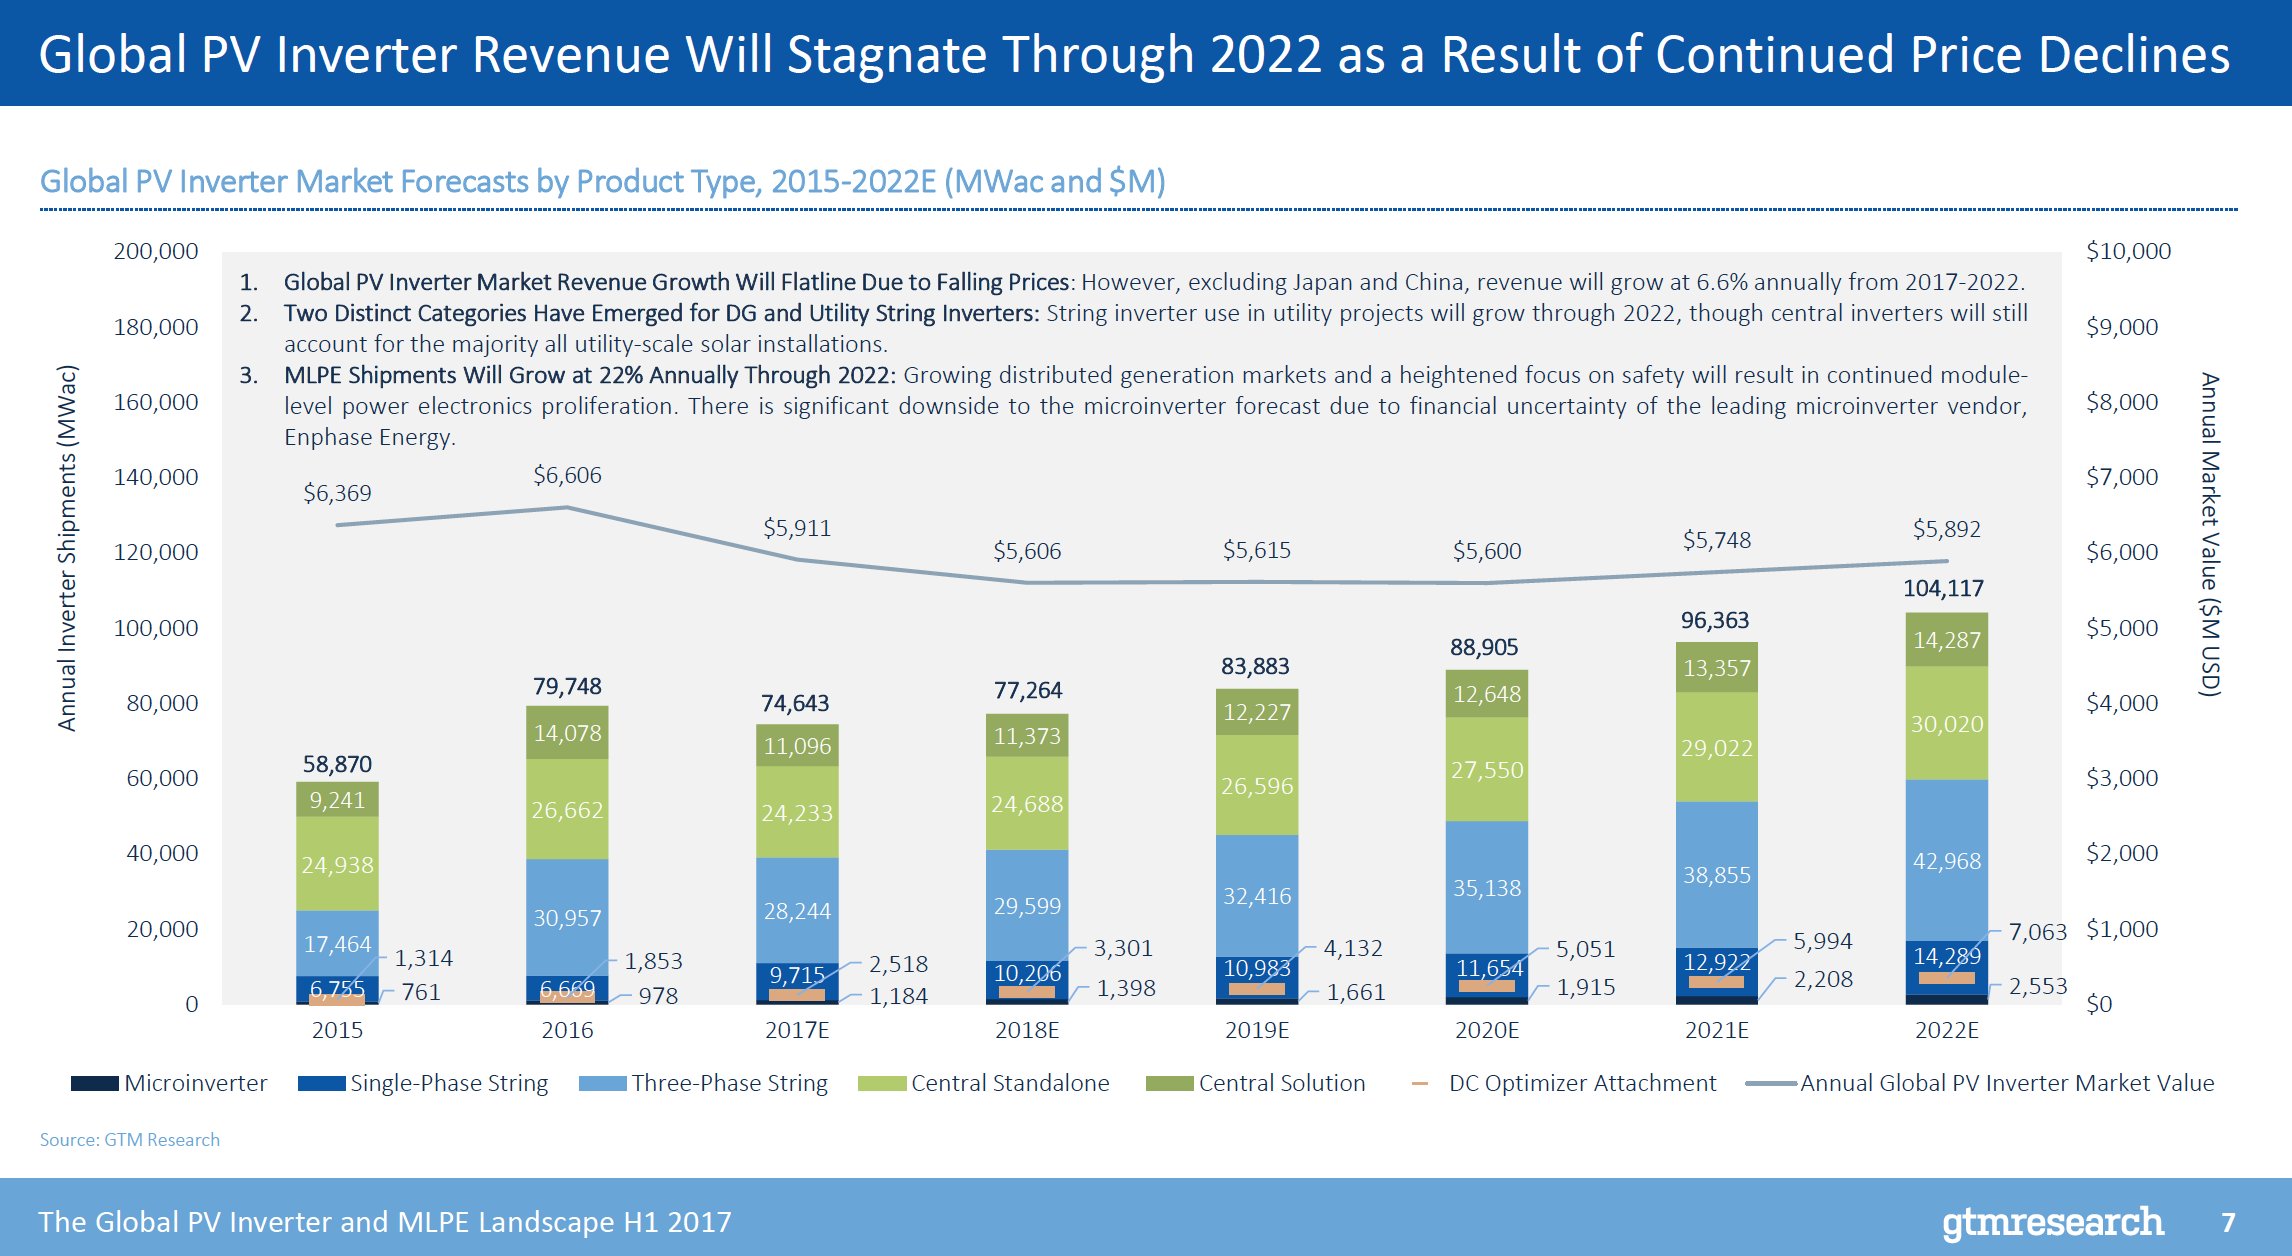
Just like modules, inverter prices are on a steady downward trajectory. Expect plenty more consolidation in the power electronics space as a result, says Senior Solar Analyst Scott Moskowitz in his latest global PV inverter guide.
Revenues will stagnate. More companies will go under, or get scooped up.
"Inverter prices show no sign of stabilizing, current technology trends have not exhausted their cost reduction potential, and many markets are still extremely fragmented. Not every company can be a global player, and so shifting demand and falling prices will result in increased market consolidation," writes Moskowitz.
Inverter shipments waver in 2017, but will see growth thereafter
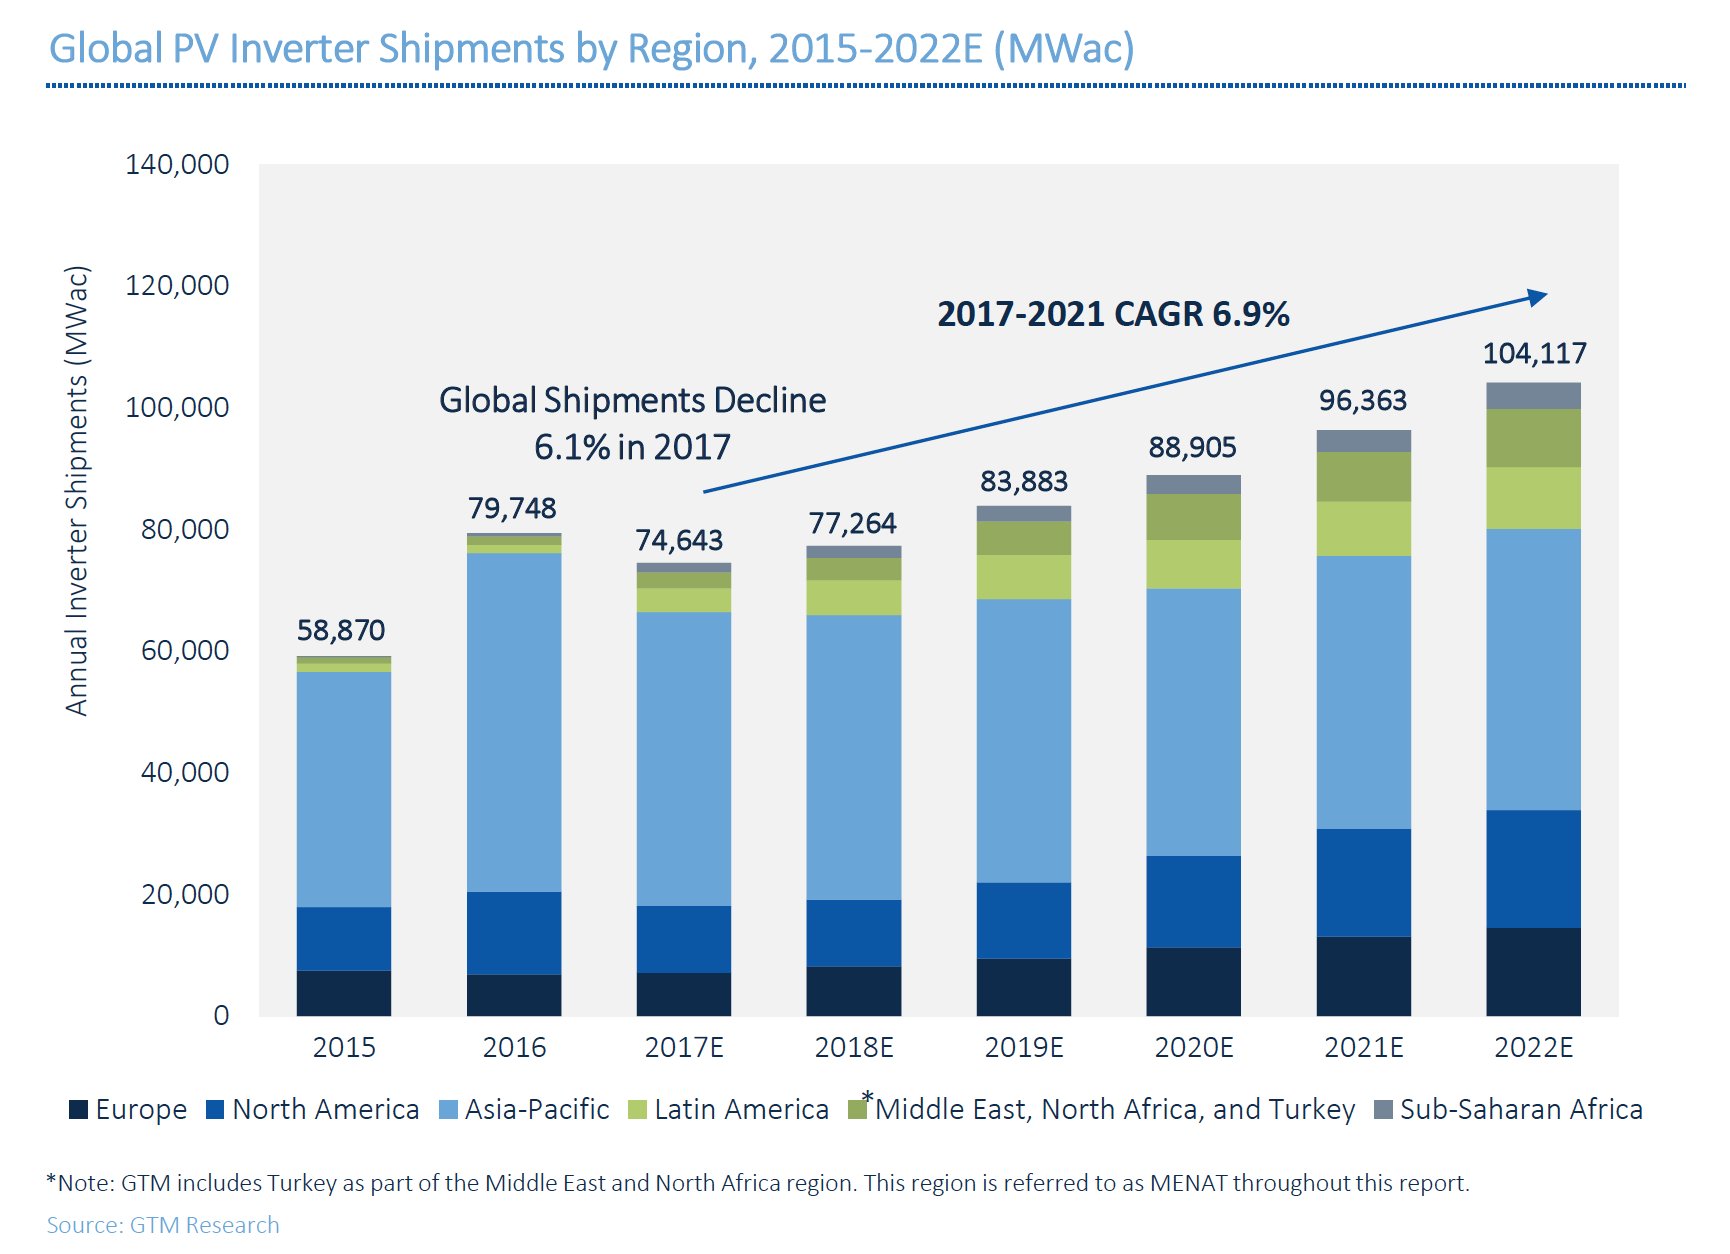
China, America and India are the biggest markets for solar installations. Naturally, they're the biggest markets for inverters, as well.
However, the dynamic is shifting, explains Moskowitz in his report. The global share of the Big Three will fall from 73 percent in 2016 to 37 percent in 2022. South Asia, Latin America, the Middle East and Africa will make up an increasing share of a diversifying global market.
This year, demand in America, China and India will fall, causing demand for inverter shipments to waver. But expect things to pick up next year as top markets rebound and other regions become more important.
Goodbye, feed-in tariffs
The last bastion of feed-in tariffs, Japan, is finally crumbling.
PV demand in the country -- once the world's most important solar market -- is retracting at an astonishing rate. The government knows it can't support its overly generous feed-in tariffs, which were as high as the yen equivalent of 38 cents (USD) per kilowatt-hour. Like the rest of the world, the country is finally turning to auctions in order to lower prices.
Tom Heggarty, a senior global solar analyst, explains: "Japan looks to be following in the footsteps of many of the world's mature solar markets, in moving away from having the whole market open to straightforward feed-in tariffs, and toward a more managed process, driven by tenders for large-scale projects."
That means a steep decline for solar in the Land of the Rising Sun. But it also means the Japanese won't be overpaying ridiculous prices when the grid is already saturated in many areas.

Speaking of market changes
Back in the U.S., a market restructuring is also underway. Not in the form of policy, but in the form of competition.
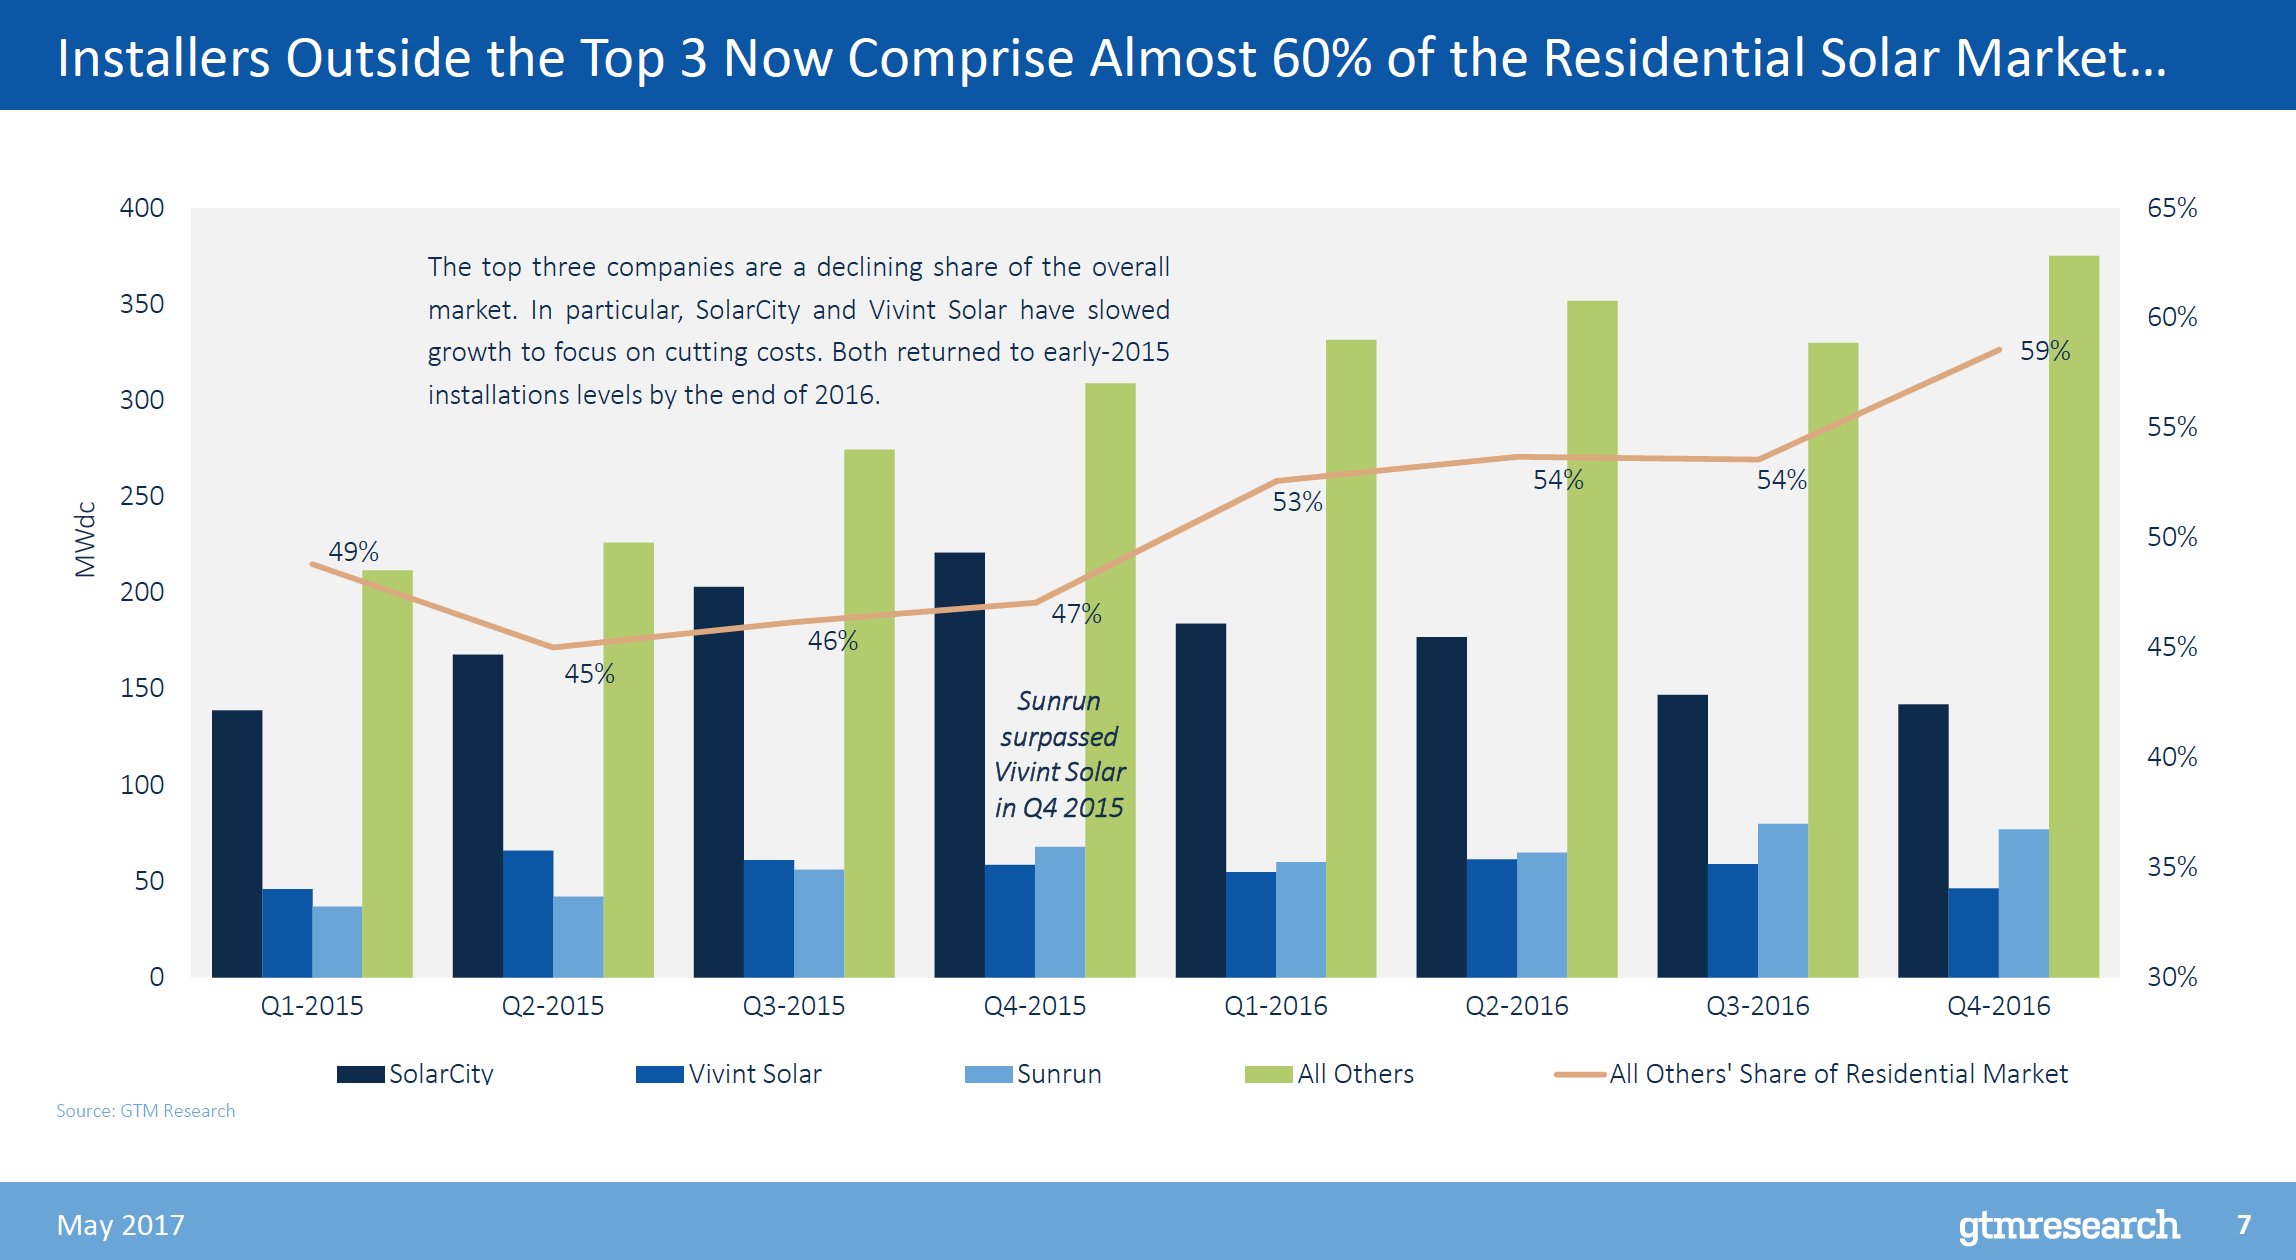
The long tail of installers continues to rise. The top national installers, still important, are losing market share to smaller, local installers. That's because their customer acquisition costs are higher, their overhead costs are higher, and their quoted prices are higher.
Nicole Litvak, a senior solar analyst (who sadly just left GTM), wrote about this competitive shift last week: "Small, local installers have the cheapest cost of customer acquisition because they rely mostly on referrals and community events. Operating on a larger scale typically requires huge investments in marketing and partnerships or, in the case of the door-to-door companies, incentivizing salespeople. This leads to thin margins at best."
As SolarCity and Vivint Solar dial back growth -- and other top players go bankrupt -- the smaller installers are growing.
Want more context as the plot thickens? Go to GTM Research for the full sets of data behind these reports.