How wealthy are the households that install rooftop solar? This question has surfaced repeatedly, most often when policymakers or regulators are considering solar incentives and/or changes to electricity rates.
In particular, battles over net energy metering often include charged debates over whether solar is simply benefiting the wealthy. In response to one such dispute in Nevada, for example, The Wall Street Journal editorial board called net metering “regressive political income redistribution."
These statements on both sides have rarely been backed by data, and instead have relied on a general impression of who solar customers might be.
Previous analyses have attempted to answer this question by using ZIP code-level data on solar adoption. Examples of previous work come from The Center for American Progress in 2013 and Kevala Analytics in 2015.
While these analyses are valuable, the methodologies employed do not account for the (sometimes wide) income variations within ZIP codes.
Today, GTM Research and PowerScout released a free report that offers -- for the first time -- household-level data on the relationship between residential solar and household income.
To listen to a conversation about the findings on this week's Interchange podcast, listen below. For more background and charts as you're listening, read on. (A big thanks to AES Energy Storage for sponsoring the show. Find out more about AES' storage offerings here.)
Our data
PowerScout identified solar households by analyzing satellite images using its proprietary Convolutional Neural Network machine-learning algorithm. The CNN model was trained with hundreds of thousands of labeled images of homes with and without solar panels until the model was able to distinguish between the two types.
We then matched the 521,449 positively identified solar homes to their income band, and compared the distribution of solar installations to the distribution of the general state population.
We used GTM Research data on total solar market size to determine sample representation of state and national solar markets.
We focused on four leading residential solar states: California, Massachusetts, New Jersey and New York. Together, these states account for 65 percent of all residential solar installations to date. We identified over 521,000 solar installations in these four states, representing 62 percent of those markets and 41 percent of all solar projects nationwide.
Here are some of our findings.
70 percent of solar households are middle-income
Based on our sample, 70 percent of solar households have annual income between $45,000 and $150,000, a range we deem “middle-income." This represents a higher proportion than the overall population of those states, where 65 percent of all households fall into that range.
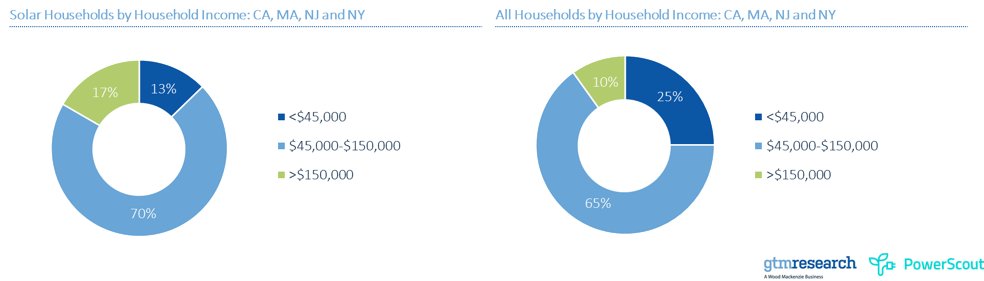
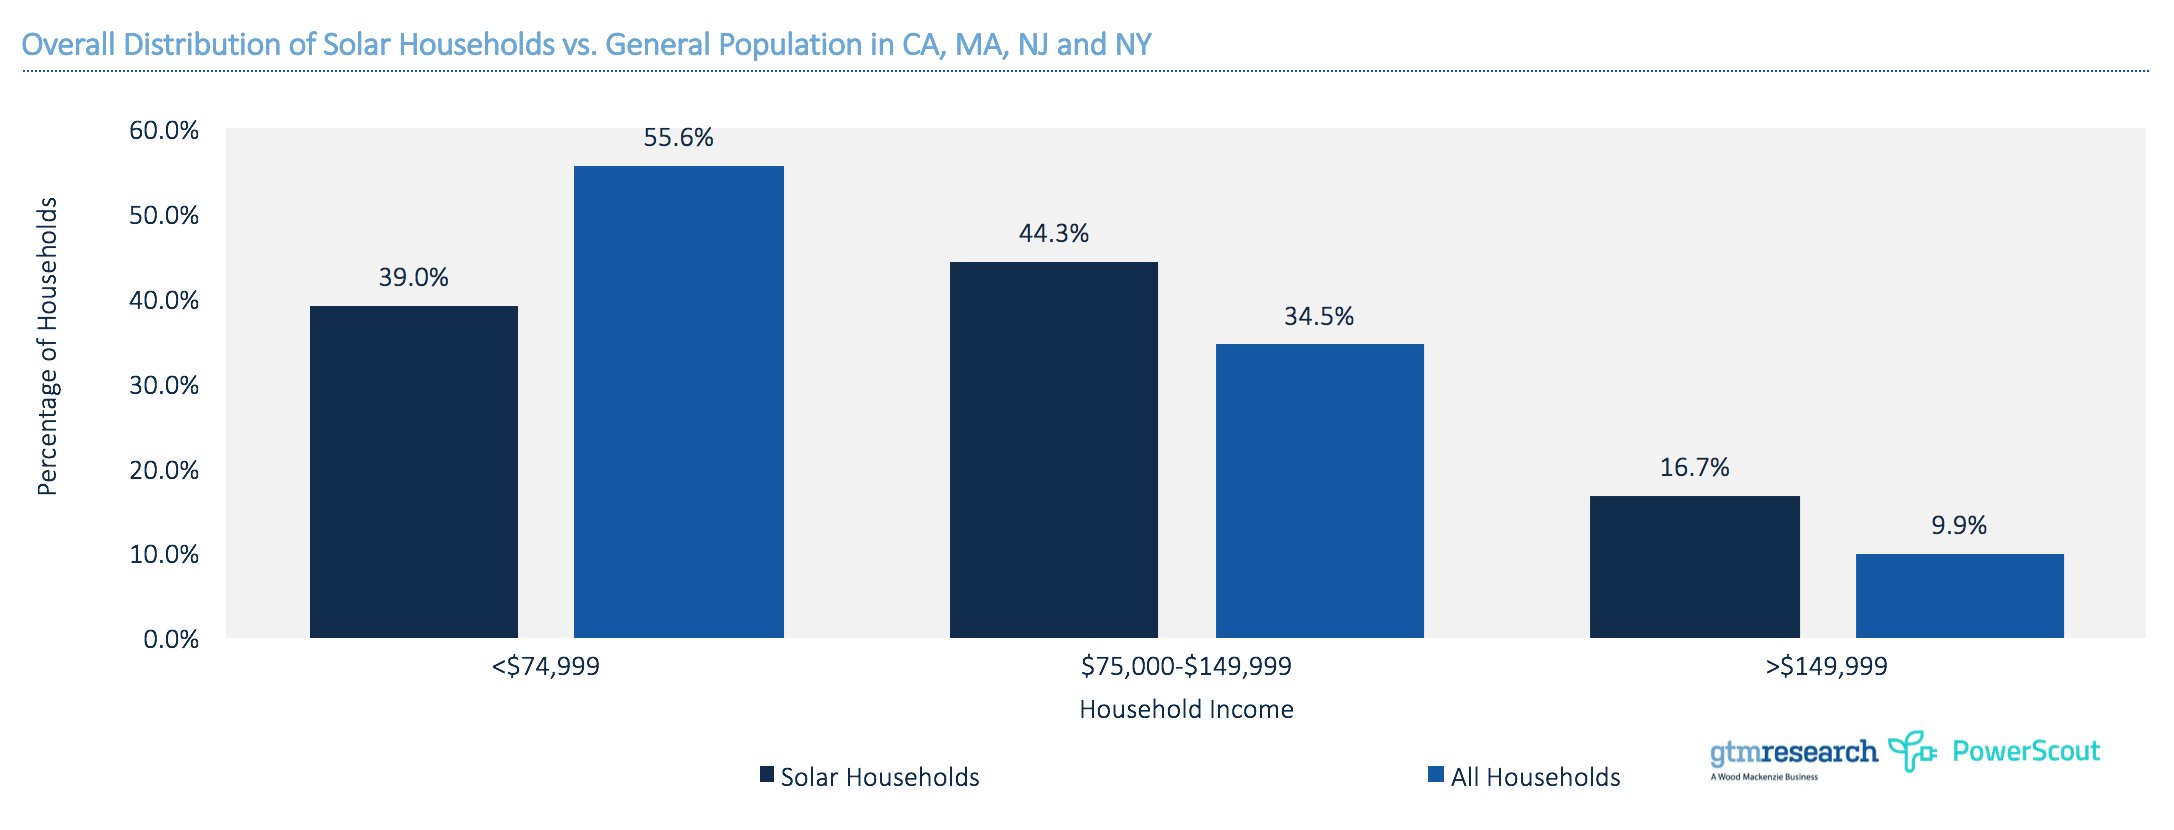
But solar households do tend to skew higher-income than the general population
In our sample, 61 percent of solar households had annual an income of at least $75,000, as compared to 44 percent of the overall population of those states.
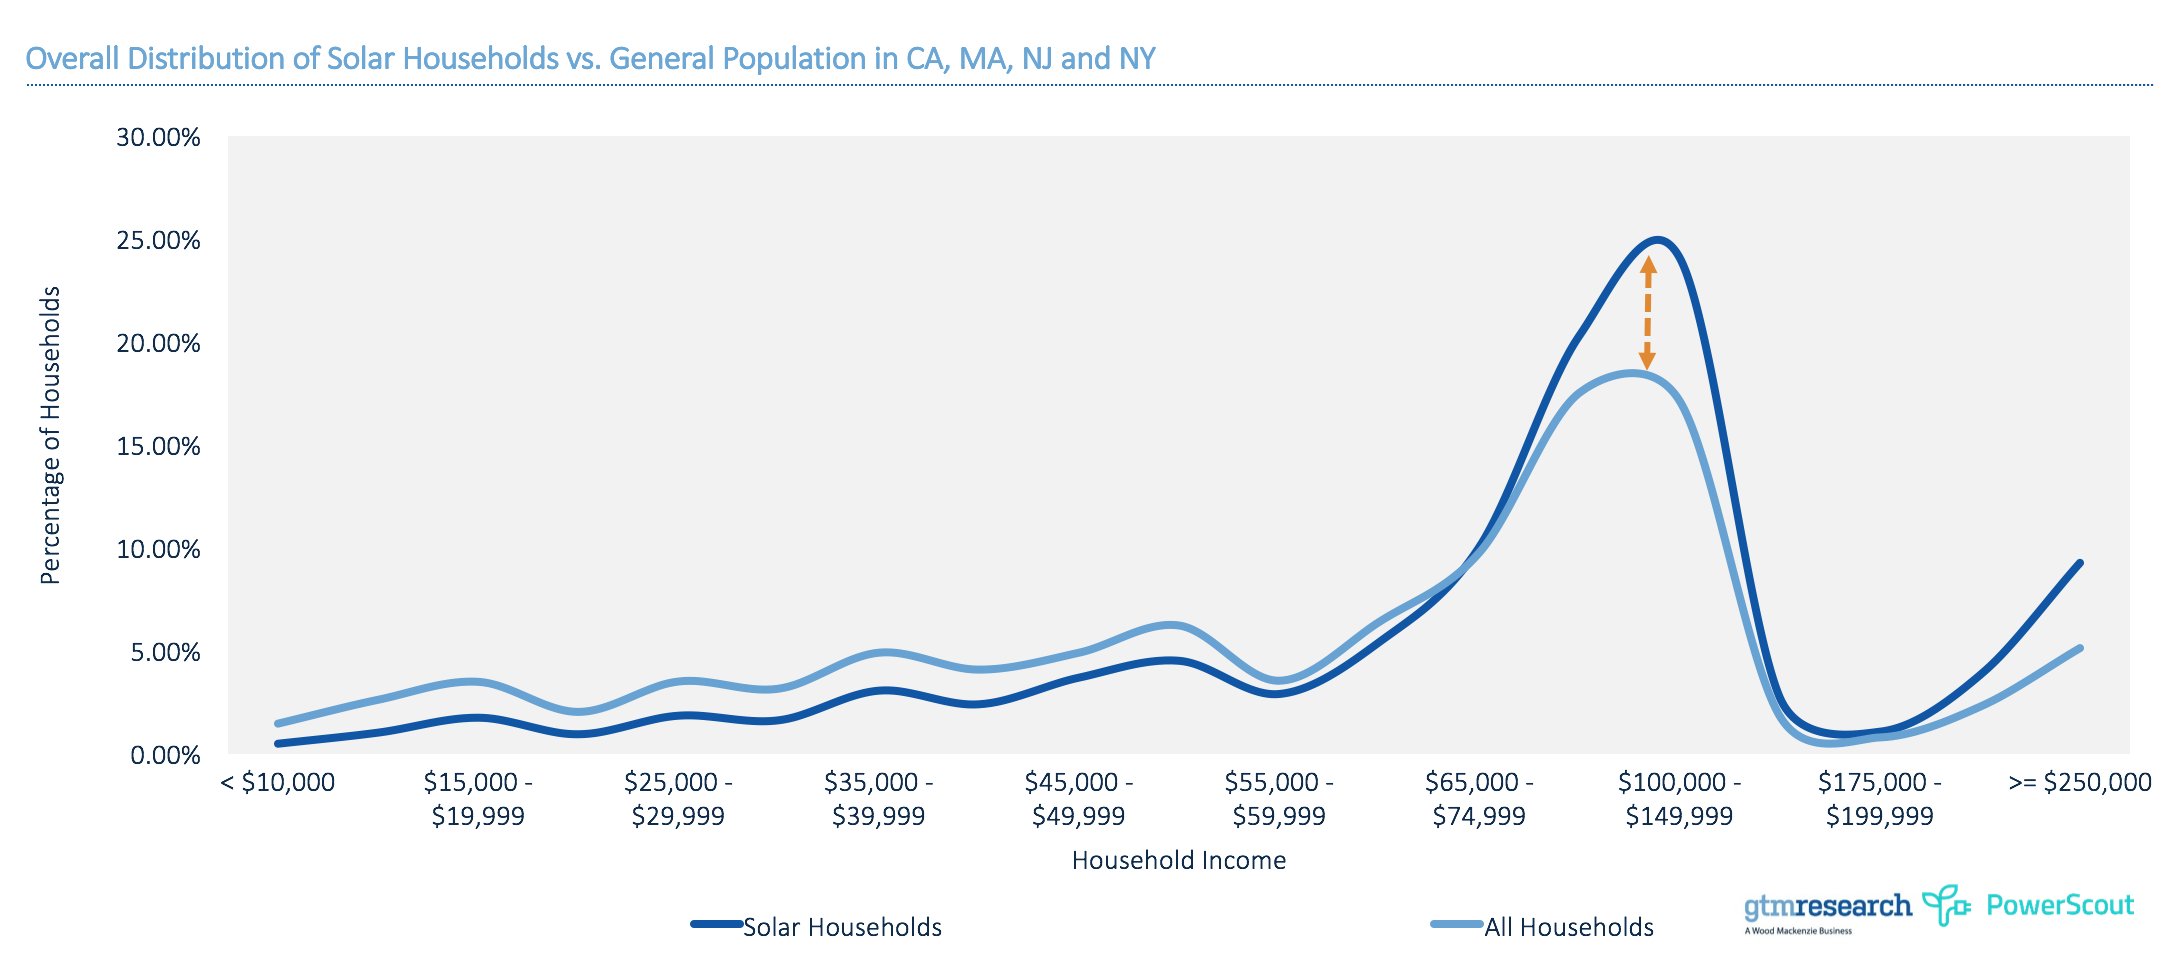
Households with income between $100k and $150k are the biggest solar demographic
Low-income households are somewhat underrepresented, but many have gone solar
In July 2016, the Obama administration announced its new Clean Energy Savings for All Americans Initiative, which set a goal to bring 1 gigawatt of new solar to low- and moderate-income solar households by 2020.
Our data suggests the U.S. is well on its way to reaching that goal. By extrapolating our sample, we estimate that there are over 100,000 low-income (<$45,000 annually) households in these four states, representing over 532 megawatts of solar capacity. If this estimate proves accurate, then these four states alone are already past the halfway mark in achieving the Obama administration target. Organizations such as GRID Alternatives, which focuses on low-income solar installation, have played a vital role in helping to bring about this level of adoption.
However, low-income households do remain underrepresented among all solar customers, and more can certainly be done to bring solar to these communities.
New Jersey has the highest share of lower-income solar households; New York has the lowest
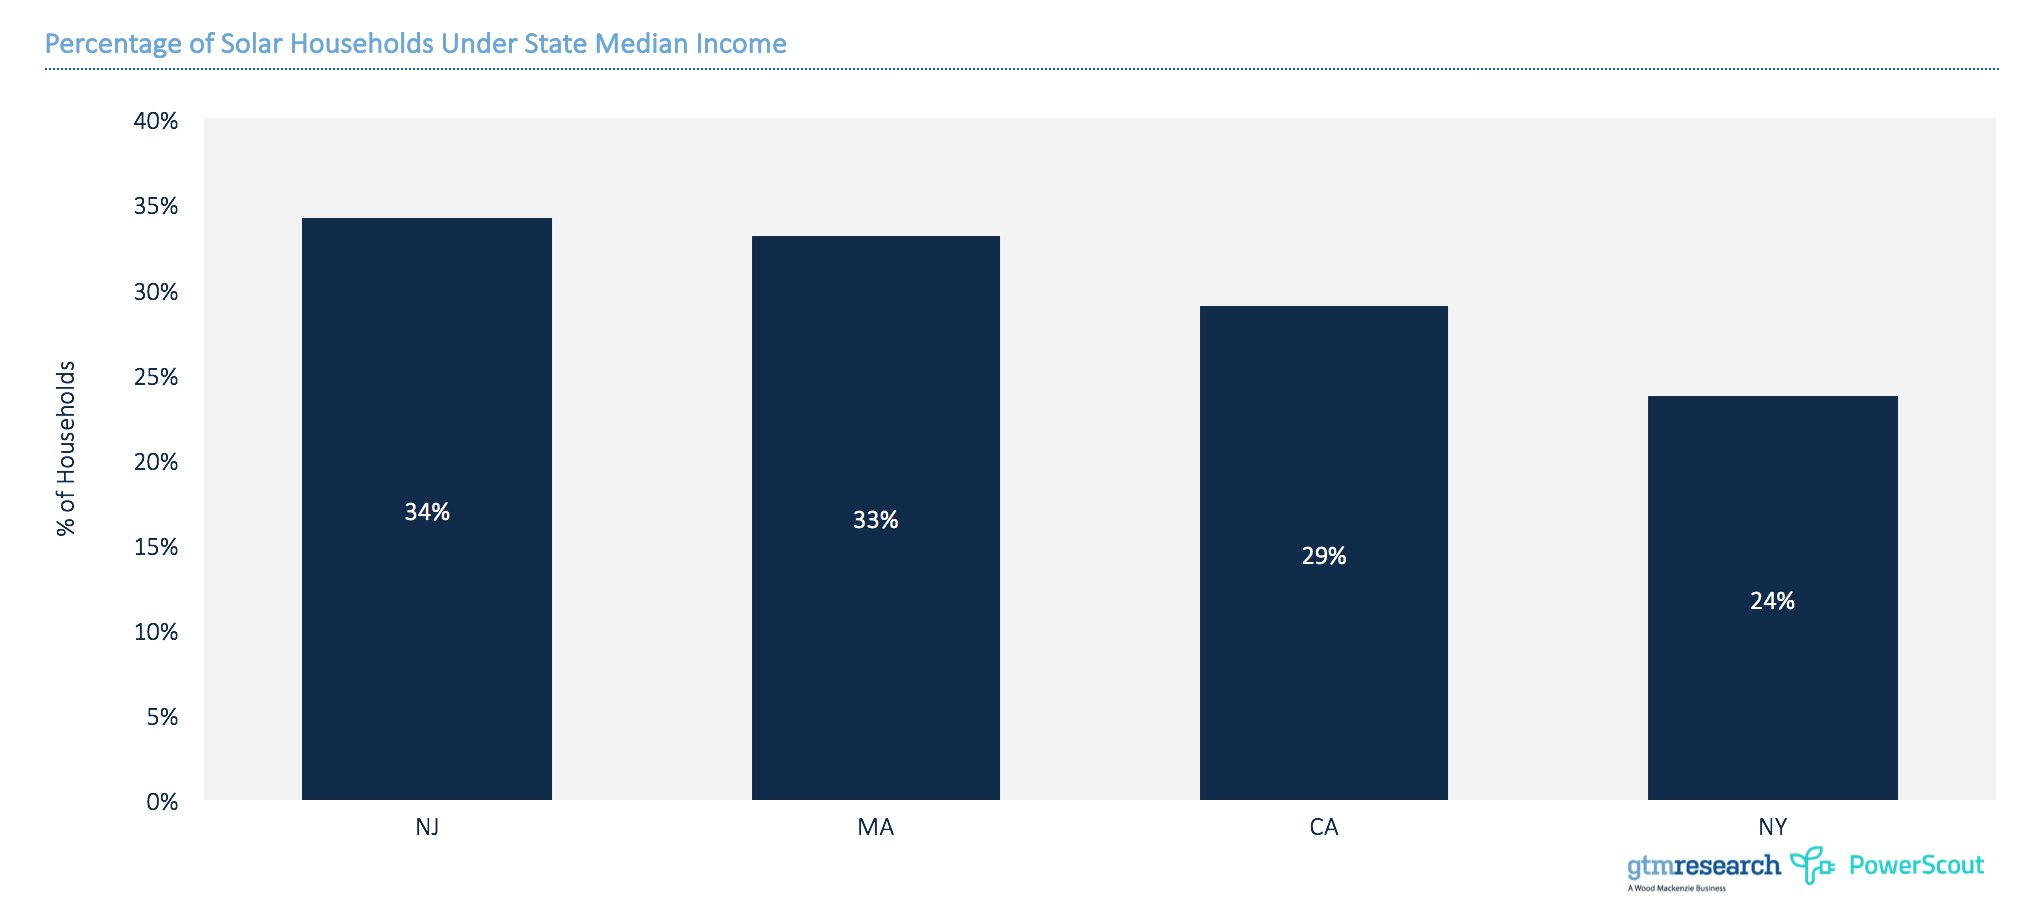
Not all states are created equal. Our analysis found substantial differences in household income for solar customers across the four states in our sample. While we cannot be certain of the sources for these differences (for example, that solar households skew wealthier in NY and CA than in NJ and MA), we suspect a range of causes including subsidies, rate structures, timing of adoption and network/neighborhood effects.
Further analysis will be needed
There are two primary limitations of our analysis.
First, our limited sample size covers a portion of four states rather than the entire national market. Future research should attempt a wider geographic scope to capture more state market diversity.
Second, our research is a snapshot, but solar demographics change over time. Future snapshots should compare against this data to determine whether, for example, lower-income households have been increasingly adopting solar as technology costs fall and financing options proliferate.
***
Shayle Kann is a senior vice president at Greentech Media and head of GTM Research. Attila Toth is the CEO of PowerScout, the first AI-enabled marketplace for sustainable smart home improvement. You can download the free report here.
Make sure to subscribe to The Interchange on SoundCloud, iTunes or Stitcher Radio, or simply copy and paste our RSS feed into the podcast app of your choice.
Paste the following URL into your preferred podcast app or click the Open Podcast Feed button to subscribe to The Interchange: