This is the first in a GTM Squared series on the companies, technologies, applications, and opportunities in the U.S. building energy management system market.
As we continue the series, we’ll dive deeper to quantify the BEMS vendor landscape. The articles to follow will answer key questions about the market:
- Which vendors have significant market share? Which are growing fastest?
- How much vendor turnover has there been in the market?
- What is the current penetration of BEMS within commercial buildings?
- Which building types offer growth opportunities?
Click here to read Part 2.
The building energy management system market is top of mind for building owners, vendors and investors. There are a total of 5.5 million commercial buildings in the U.S., which together account for 18 percent of all energy consumed.
These commercial buildings spent a total of $149 billion on energy in 2012 (the most recent year of data). While 4 million of these buildings are less than 10,000 square feet in size, there still is a robust market of large buildings that require building energy management software. Moreover, many small retail and restaurant buildings are owned and operated by large enterprises.
In aggregate, these small buildings account for significant energy spend. According to the Commercial Building Energy Consumption Survey, commercial buildings spend $1.44 per square foot per year on electricity and $0.30 per square foot per year on natural gas.
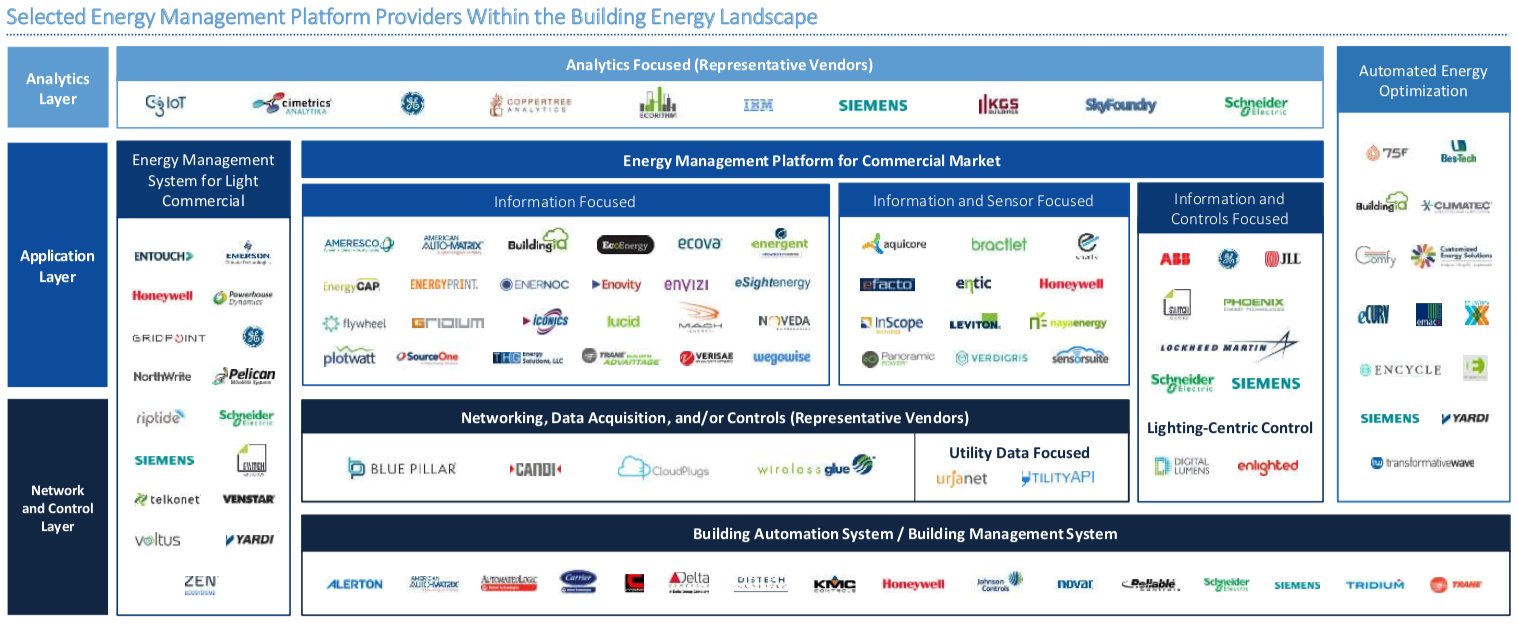
In 2017, GTM Research found that $650 million in venture capital had been invested since 2010, going to 48 different companies. In reality, there are more than 48 vendors providing BEMS capabilities. There are some signs of consolidation, as a few firms recently have been acquired by larger building solutions providers.
For example, Acuity acquired Lucid and Ingersoll Rand purchased Agilis Energy, a firm that it had partnered with extensively. Additionally, Italian utility Enel purchased EnerNOC about a year ago, a deal that included acquisition of a robust energy management software solution.
Source: GTM Research
But despite these signs of consolidation, the market remains fragmented and complex. Among industry participants and observers, there is demand for a more detailed look at the total market penetration of BEMS, the market shares of key vendors, and the growth opportunities within the market.
Most small firms do not release sales or revenue data, which makes it hard to estimate their actual performance. Large firms, which may have their own BEMS offerings, provide limited detail on adoption due to the relative immateriality of these solutions compared to their other products and services.
However, many of these firms do benchmark their customers’ buildings through Energy Star, which publishes a list of the participating vendors and the number of buildings each has benchmarked.
Most of the key vendors in the BEMS market are included in the Energy Star data set. Furthermore, it’s a good source because a significant number of commercial properties in the U.S. have been benchmarked. Combined with high-level data from the Commercial Building Energy Consumption Survey (CBECS), we’re setting out in this GTM Squared three-part series to estimate the market penetration for building energy management systems, and future growth prospects based on currently unaddressed buildings.
Sizing up the market
While the smallest 50 percent of buildings make up only 9.2 percent of total floorspace, the largest 0.8 percent of buildings account for 20.4 percent of the space. Among all building types, about 50 percent of commercial floorspace has been benchmarked in Energy Star.
Comparing Energy Star data from 2015 with 2012 CBECS data provides some useful insight on the market segmentation.
- Offices: 60,848 office buildings were benchmarked in Energy Star.
- Retail: This segment encompasses three Energy Star building types — bank branches, retail and supermarket. A total of 97,235 of these buildings were benchmarked in Energy Star.
- Educational: Energy Star provides two categories — K-12 buildings and residence halls. The vast majority of benchmarked buildings were primary and secondary schools, 55,019 compared to just 3,958 residence halls.
- Medical: Energy Star reported data for two building types — hospitals and medical offices. There were 4,939 total hospitals benchmarked and 5,422 medical offices, but the hospitals are much larger.
- Lodging: Lodging buildings are included in a single Energy Star category and had 10,412 benchmarks
Annual Buildings Participating in Energy Star's Data Benchmark
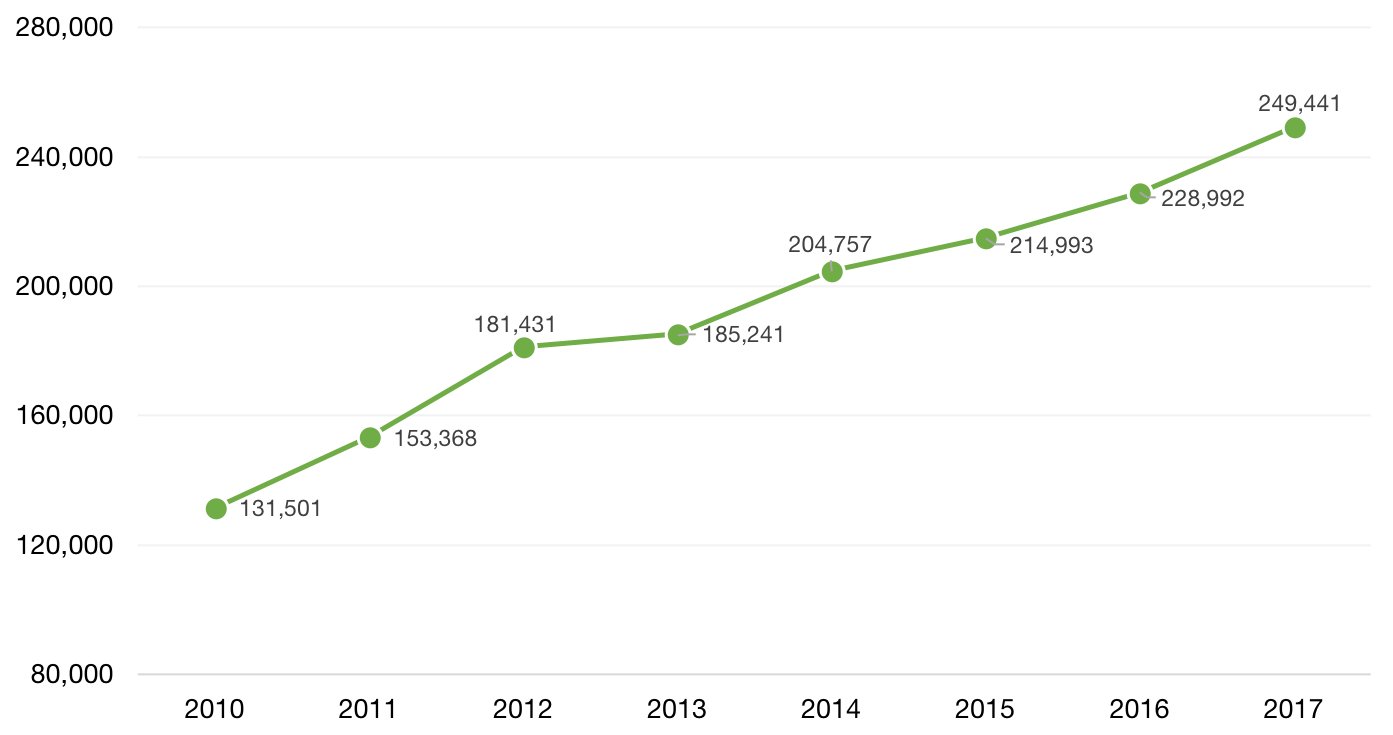
Source: Energy Star
Among the five primary commercial building types — offices, retail, medical and lodging — Energy Star has strong penetration. These building types are core targets for many BEMS vendors. Other traditional targets for software vendors — multifamily and restaurant buildings — are not reported as individual subcategories, but are included in Energy Star program.
In our next article, slated to be published Thursday, August 16, we’ll start to quantify just how large these segments are and look at the vendor strategies for penetrating each segment.