The U.S. energy storage industry installed a record amount of power capacity in the first quarter of 2019.
The 148.8 megawatts of new grid storage capacity represented a 232 percent growth over Q1 2018, according to the latest edition of the Energy Storage Monitor report produced by Wood Mackenzie Power & Renewables and the Energy Storage Association. The ESM tracks storage in terms of instantaneous power capacity (megawatts) as well as energy capacity (megawatt-hours).
Historically, the first quarter tends to be the smallest of the year for storage activity, but Q1 2019 narrowly edged out the last quarter of 2016 for the title of most megawatts deployed.
The previous record came during the Aliso Canyon procurements, in which California fast-tracked battery development to respond to a grid emergency. The new record came from business as usual, as more states pursue storage technology to deliver rapid-fire ancillary services, shift solar power for nighttime consumption and provide local capacity without local emissions.
"People are putting projects in the ground," said Energy Storage Association CEO Kelly Speakes-Backman in an interview. "We’re seeing state policy engagement and general awareness by the states. It’s not just about incentives; it’s about beginning to address long-term regulatory frameworks."
This initial achievement sets the industry up for another record year. Installations in 2019 will more than double those from 2018, and 2020 deployments will triple 2019, WoodMac analysts predict. The five-year forecast culminates in 4,543 megawatts delivered in 2024, a meteoric rise compared to the scope of the industry today.
That forecast rose 4 percent compared to last quarter's report, due to major procurements announced in Florida and Hawaii.
As for dollar signs, the overall value of the U.S. storage market is expected to double this year to nearly $1 billion. It will rise to $4.837 billion in 2024, analysts predict.
Surprise winners in Q1
- New Jersey. The Garden State built nearly half of the quarter’s utility-scale megawatts, thrusting it into the ranks of top statewide markets, at least temporarily.
- Behind-the-meter storage. Customer-sited batteries made up almost half of all megawatts deployed this quarter, and more than half of all megawatt-hours.
- Commercial and industrial storage. This subset of behind-the-meter storage set a personal best, delivering 44.9 megawatts and 108.7 megawatt-hours in Q1. After a series of on-again, off-again quarters, C&I showed it can grow for two quarters in a row.
- Megawatts vs. megawatt-hours. Overall energy capacity, measured in megawatt-hours, fell 23 percent compared to the previous quarter even as megawatts deployed rose. This reflects shorter-duration projects coming online during the recent quarter, due to an unusual preponderance of systems geared for fast-response grid services.
- Florida. The analysts added Florida to the ranks of states that they break out individually for storage research. The Sunshine State features a heating-up residential market and a 409-megawatt procurement by utility Florida Power & Light, announced in March.
Why so big?
Battery supply constraints hit the industry hard in the second half of 2018, thanks in large part to a sudden surge in demand for capacity in the South Korean market that lowered the volume of cells available for export. The bottleneck pushed some projects forward into 2019, contributing to the unusually busy first quarter.
Geographical diversity also helped. In previous years, single markets like PJM or California often dominated quarterly deployments. Both of those early leaders were quiet this quarter, but the combined efforts of New Jersey, New York, Arizona and Massachusetts kept the count high.
That’s just on the utility-scale side. The behind-the-meter segment played a major role this quarter, accounting for 60 percent of the total megawatt-hours. Within that category, C&I won out with twice as much energy capacity as the residential sector. This marked the first time since Q2 2017 that the C&I market grew for two consecutive quarters.
“I think we may see continued steady growth in that sector,” Speakes-Backman said of this segment. “The story is getting out about how it can reduce peak demand.”
What got built?
Among the utility-scale projects that are possible to track individually, New Jersey led the quarter with two 20-megawatt/20-megawatt-hour projects that Viridity developed to participate in PJM’s frequency regulation market.
Those projects bucked the trend in that market, which used to be the hotspot for U.S. storage activity, but quieted down after rule changes reduced the compensation battery plants could earn.
“It’s going to be very interesting to see if they have indeed cracked the code on that PJM market,” said Daniel Finn-Foley, a principal analyst covering energy storage at WoodMac and a coauthor of the report. “We haven’t seen significant projects in PJM since, really, 2015, when the market went through that big shift.”
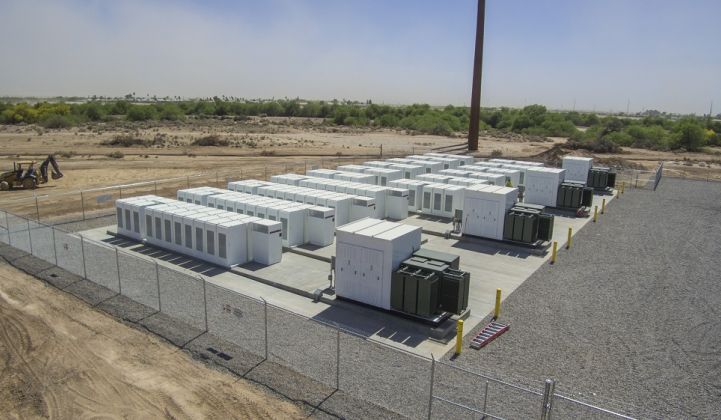
New York also posted a 20-megawatt system for frequency regulation. Arizona utility Salt River Project completed a 10-megawatt/40-megawatt-hour standalone storage project, giving it the second-place ranking for energy capacity.
Finn-Foley cautioned against reading too deeply into the quarterly results, as they are still based on a small number of projects, given the early stage of the industry’s development.
“Because there are so few projects going in quarter to quarter, a single project going in late March versus April can completely change the quarterly results,” Finn-Foley said. “As we scale up, that’s going to be less and less the case.”
After the growth expected this year, 2020 will be when energy storage goes from "a nascent market to a market at scale," he added.
***
The U.S. Energy Storage Monitor executive summary is available to download for free here.


 41
41
 15
15
 9
9