The U.S. solar industry logged a strong 10.6 gigawatts of new solar PV capacity last year, and officially passed the 50 gigawatt milestone for total installed capacity, according to the U.S. Solar Market Insight 2017 Year in Review.
Both the residential and utility-scale solar segments saw installations decline for the first time in 2017, due to policy changes, business model shifts and leveling-out following a year of explosive growth in 2016. But while some market segments and certain states saw slower growth, others performed exceptionally well.
Minnesota, for instance, had a banner year in community solar, with more megawatts installed in that state last year than across the entire U.S. community solar sector in 2016. The non-residential solar market segment was the overall star of 2017, growing 28 percent year-over-year and notching its fourth straight year of annual growth.
This week’s State Bulletin takes a closer look at the latest SMI report to find out which states did well and which ones some saw weakness in 2017.
The Sunshine State joins the top 10
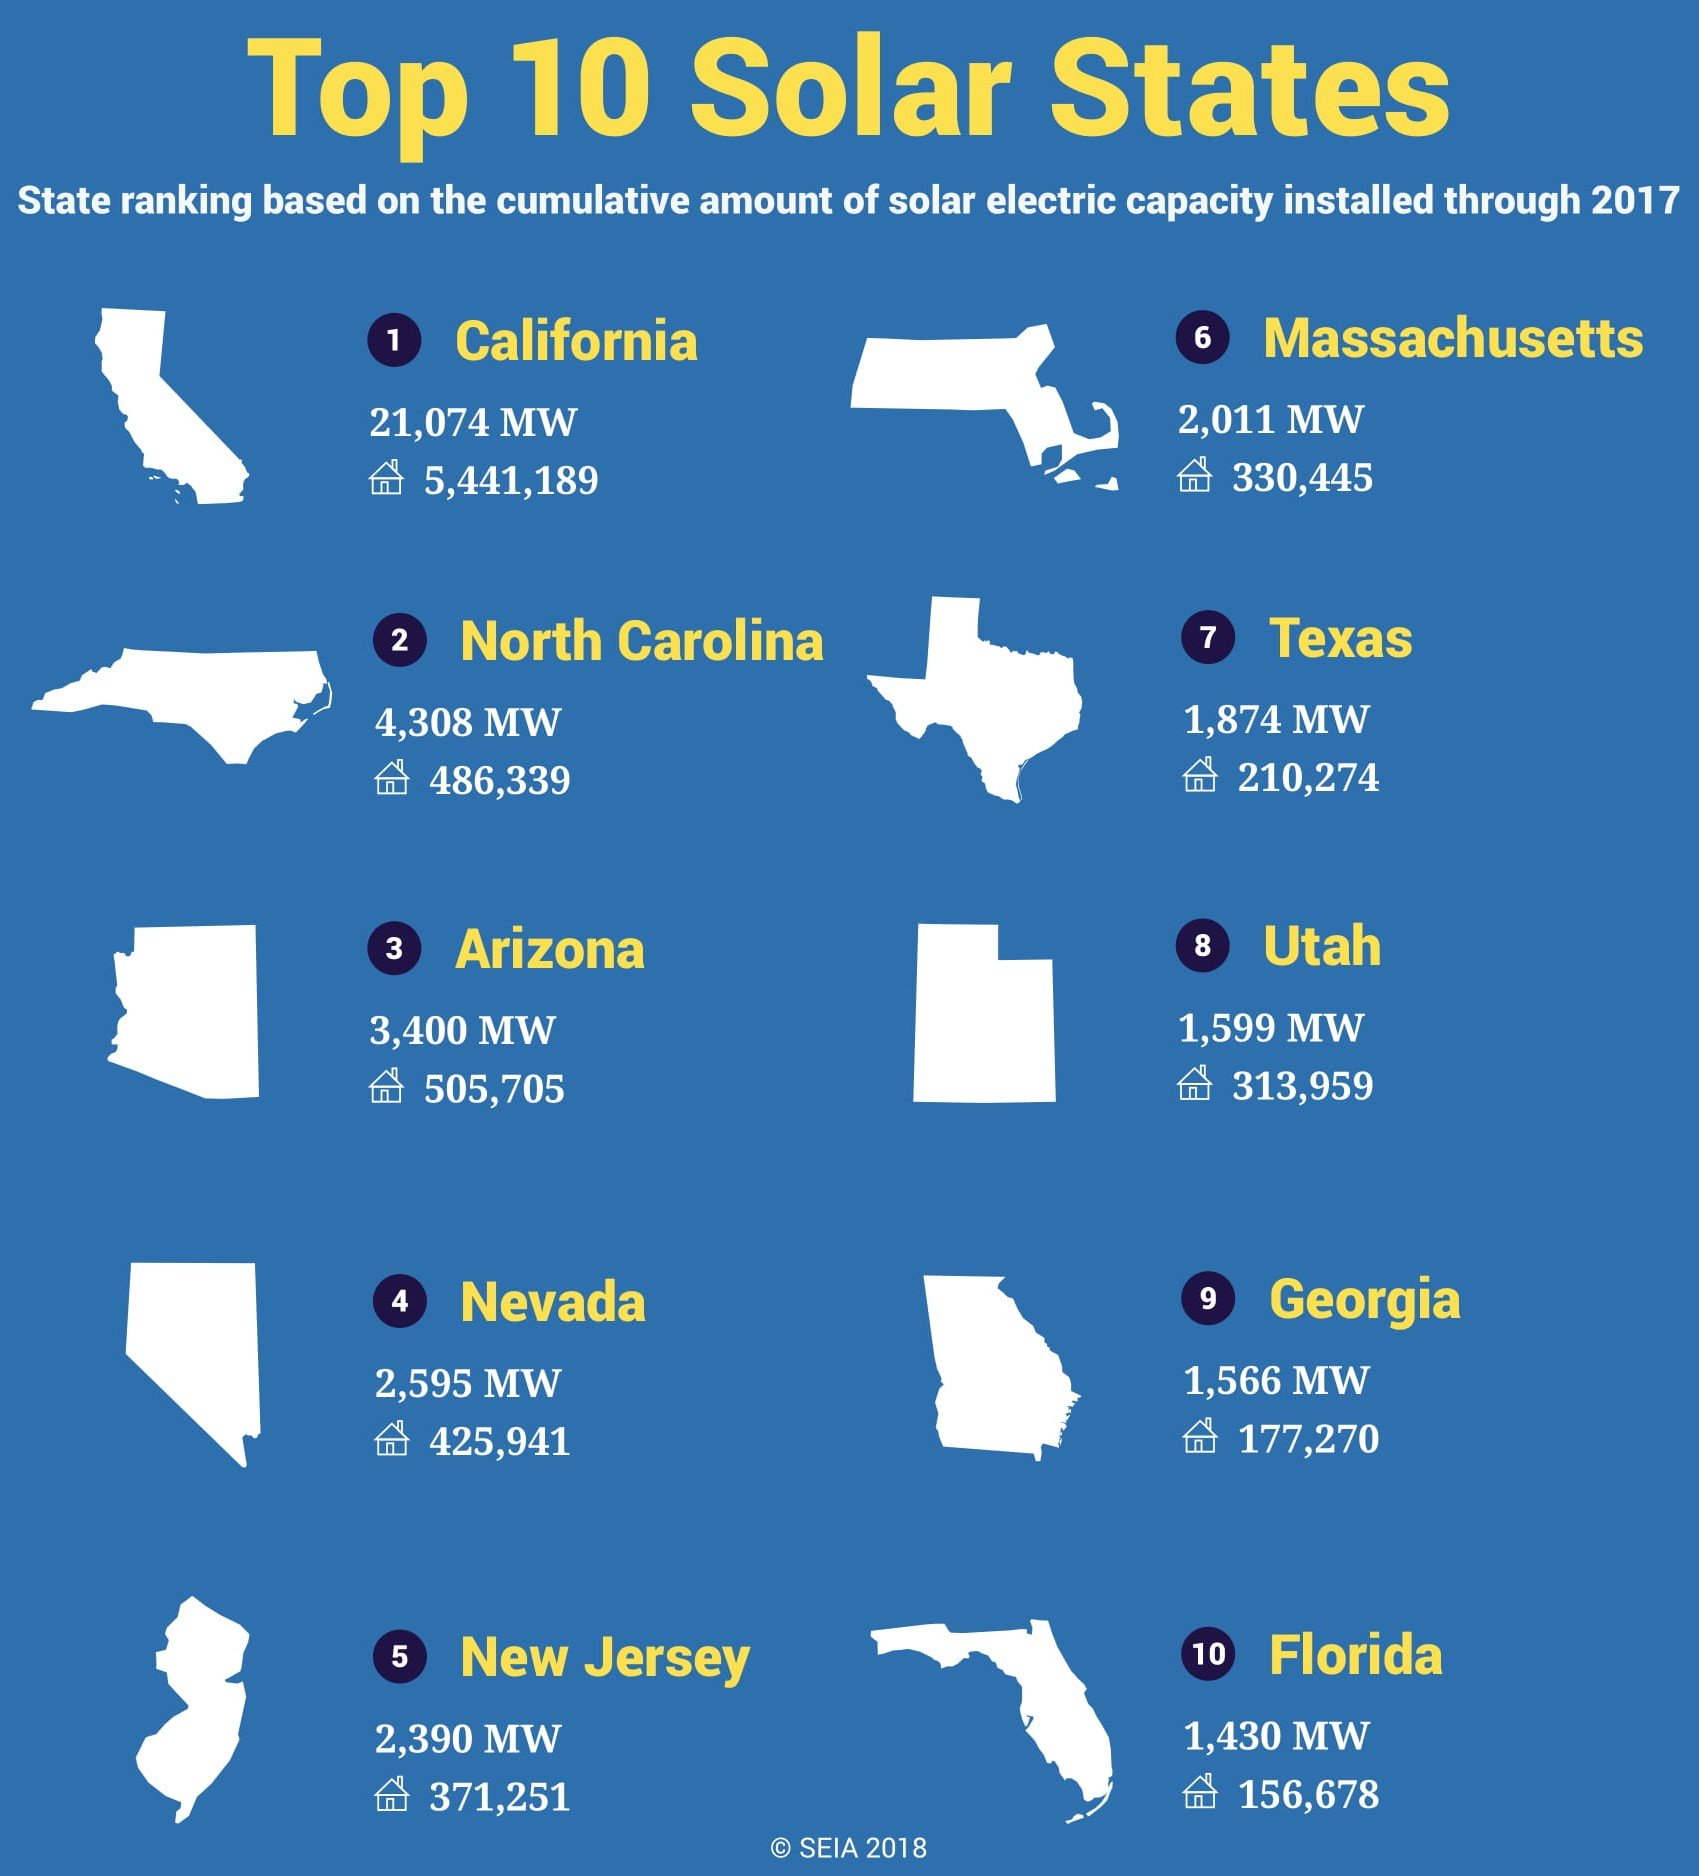
Florida has always had the potential to be a leading solar state. Last year, it finally made a significant move up the ranking.
The Sunshine State overtook New York on the list of the top 10 states for installed solar by adding nearly 750 megawatts of PV last year -- which is nearly double the 400 megawatts Florida installed in 2016 (all figures in megawatts-DC). The state ranked third for solar installations in 2017 and now sits in 10th place overall.
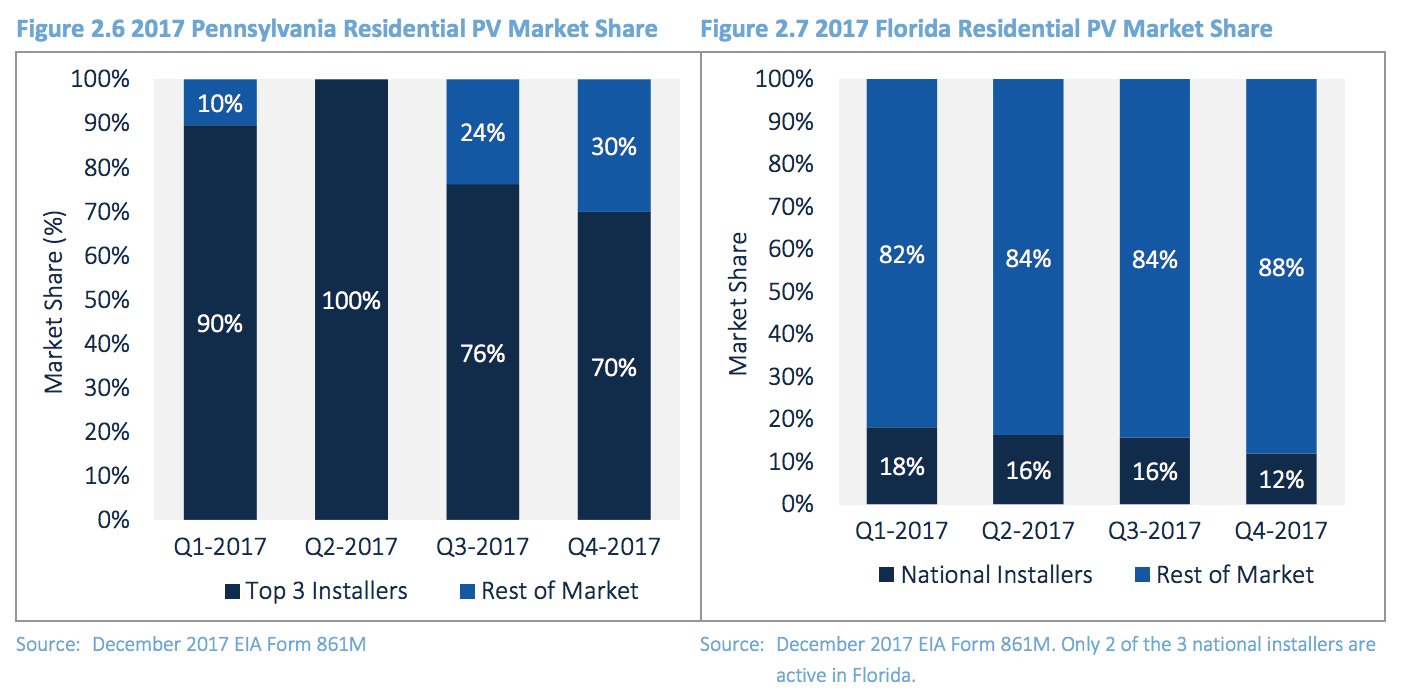
In the residential solar segment, Florida actually outperformed GTM Research’s forecasts by installing 58 megawatts. Pennsylvania also emerged as a growing residential solar market in 2017, with 52 megawatts installed. But GTM Research notes that these two markets are substantially different.
While Florida’s market has been driven primarily by local and regional solar installers, Pennsylvania’s growth has largely come from national firms. Based on growth trends observed in more mature residential solar markets, a reliance on national installers could lead to inconsistent growth as business models shift and major players revise their state strategies.
In particular, this has been an issue for California, New York and Massachusetts (more coverage on this phenomenon to come). In these markets national installers account for up to 50 percent of installed capacity, causing the three leading markets to see significant downturns as a function of pullback from the national installers. In Pennsylvania, national installers accounted for nearly 100 percent of capacity additions in 2017.
“Pennsylvania’s market may prove an instructive example of what constitutes unmanageable growth, while Florida may provide the blueprint for sustainable growth via local installers gradually scaling up operations,” the report states.
Minnesota and the rise of community solar
As noted in the introduction, Minnesota emerged as a leading player in the non-residential solar sector in 2017, with 250 megawatts installed in that segment last year, 241 megawatts of which was community solar. The state’s cumulative community solar installations now total 281 megawatts. Minnesota’s community solar garden program officially launched in 2014, and initially got off to a slow start. Last year, however, with most of the kinks worked out, the program took off.
This year is likely to surpass 2017 as Minnesota’s biggest year for community solar, according to the SMI report. GTM Research currently projects the state will install 350 megawatts of non-residential solar in 2018, the vast majority of which will be community solar.
“Minnesota is by far the largest community solar market in the U.S., and it will remain the largest community solar market as the remainder of the state’s robust pipeline is built out in 2018,” the report states. However, things will start to shift in 2019.
Once Minnesota’s current community solar pipeline is built out this year, the pace of installations is expected to slow dramatically. The report notes that community solar subscriptions have become much less attractive under Minnesota’s Value-of-Solar Tariff scheme and even less so under the new Value-of-Solar Vintage Bill Credit Rates.
Another issue is that residential subscribers currently make up a small share of subscriber capacity in the program (just 7 percent as of January 2018), but the residential subscriber base will become an increasingly important target demographic as the pool of C&I customers is exhausted. Regulators are now considering a residential subscriber adder and a residential subscriber capacity carve-out for community solar projects to help boost adoption.
“The adder could provide a modest boost to developers dealing with high customer-acquisition costs in the reduced bill credit environment,” the report states. However, Xcel Energy has stated a preference for the carve-out option.
While Minnesota was the clear leader in the community solar segment, Massachusetts also had a strong year, with nearly 93 megawatts installed in 2017. Together, those two state markets accounted for 80 percent of the community solar market last year. Community solar now accounts for nearly 20 percent of non-residential solar PV, with the remainder made up of commercial and industrial projects.
The non-residential solar segment was the only segment to grow last year. Just shy of 2,150 megawatts of non-residential solar were installed in 2017, up 28 percent from 2016. Community solar programs in New York and Maryland are expected to spur growth in this market segment through the year, while Illinois is expected to become a major community solar market in 2019.
Utility-scale solar markets to watch
Utility-scale solar PV continues to hold the largest share of installations in the U.S. solar market and helped the solar industry achieve another year of double-digit growth. A total of 10.6 gigawatts of solar were installed in 2017, of which utility-scale solar made up 6.2 gigawatts.
Overall, solar installations saw a 30 percent decline last year, marking the first year both residential and utility-scale solar actually contracted year-over-year. However, the market still grew 40 percent over 2015 levels.
In the utility-scale solar sector, the drop last year was expected as the market settled following a banner year in 2016. The market saw a flood of utility-scale solar installations in 2016 ahead of the anticipated expiration of the 30 percent federal Investment Tax Credit, which was ultimately extended through 2019 and is now set to decline over time.
The SMI report also notes there was a slowdown in the latter half of 2017 due to uncertainty surrounding import tariffs on imported cells and modules.
While several utilities, including NV Energy and AEP Ohio, announced requests for proposals or plans for solar procurement, “offtakers remained hesitant to sign new [power-purchase agreements] before the tariffs were announced,” the report states. “While no utility has canceled or modified previously announced plans to procure additional utility PV capacity, GTM Research expects some utilities will adjust procurement timelines and delay target commercial operation dates to better leverage tariff stepdowns.”
But while tariffs will weaken utility PV’s economic competitiveness, the prospect of falling prices should allow PPA pricing to remain attractive.
The Public Utility Regulatory Policies Act (PURPA) is another factor that affected the performance of the utility segment in 2017, and one that is heavily influenced by state-level policy. The delay and cancellation of projects under PURPA in markets such as Idaho, Montana and South Carolina played a role is causing the market to shrink.
At the beginning of 2017, PURPA was expected to be the largest driver of utility-scale solar for the year. Ultimately, 1.6 gigawatts of PURPA projects came online in 2017, representing 25 percent of the total annual capacity, although it was still the second-largest driver, behind voluntary procurement.
Going forward, GTM Research projects PURPA will drive less than 15 percent of new procurement, with only two states, Massachusetts and Michigan, seeing more than 200 megawatts of new Qualifying Facility, or QF, development in 2018.
Through its SMART program, Massachusetts is expected to see roughly 400 megawatts out of a total 1,600 megawatts allocated over several years by QFs. In Michigan, Consumers Energy says that in seven months it has received 296 megawatts of interconnection requests through PURPA, and it has asked the Michigan Public Service Commission to intervene and enable the utility to reject certain contracts.
“This continues the trend of utilities petitioning for reprieve from PURPA at the state level that has been seen in Montana, Utah, Idaho, Oregon and many other states,” the report states.
At the federal level, the PURPA Modernization Act of 2017 (HR 4476) was introduced in the House of Representatives and aims to stem development of additional QF renewables by allowing utilities to challenge the 1-mile rule and reject QF contracts based on having access to wholesale markets. It’s currently unclear how the bill will fare in the Senate.
A few more state highlights
A number of other notable state policy developments were highlighted in the SMI report.
The New Jersey legislature is making an effort to accelerate the state’s renewable portfolio standard and increase the solar carve-out. These provisions were initially included in a comprehensive energy bill (S877), but have since been moved into a new Senate bill (S2314), with a companion bill in the State Assembly (A3723). Neither bill is currently available on the New Jersey state website, however. In addition to increasing the RPS target for solar (to 5.1 percent by 2023 as of the last reading), the legislation would direct regulators to begin establishing a community solar program and would close the state’s current solar renewable energy credit (SREC) trading program in an orderly way. Fixing the SREC program and putting in place the next generation of solar incentives in the Garden State provides a significant upside to GTM’s long-term projections.
South Carolina will soon hit its net metering cap. At the current run-rate, Duke Energy is expected to hit the limit in the second quarter of 2018, while SCE&G may last until 2019. Since the SMI report was released, a bipartisan group of South Carolina lawmakers introduced legislation (House Bill 4421) that would raise the NEM cap and introduce other positive solar reforms.
Rhode Island launched a single, statewide permit application. The move is notable given that complex permitting processes are commonly cited as a significant pain point among U.S. solar installers.