_721_420_80_s_c1.jpg)
Quotes for large solar photovoltaic projects in sunny parts of the United States are coming in at an astounding 4.5 to 5.5 cents per kilowatt-hour. These projects enjoy economies-of-scale advantages compared to smaller or rooftop-type photovoltaic projects. There is, however, one other very important technology advantage: since the utility-size systems are ground-mounted, trackers can be used to allow the panels to follow the sun throughout daylight hours.
The advantages of trackers are dramatic, often increasing annual power production 20 percent compared to fixed mounted systems. For projects in most states, trackers will more than make up for their modest increase in upfront costs over the lifetime of a system, often leading to the lowest levelized cost of electricity (LCOE) in projects. Not only is annual production increased, but tracking systems also produce more power during peak demand hours compared to fixed mounted systems.
Tracking the sun can lead to significant advantages
Large PV projects are ground-mounted, presenting a basic question -- should the utility go with a fixed mounted PV system or a system that tracks the sun during the day? Key considerations include the total annual electricity production and the amount of electricity produced during hours when electricity demand is at its highest.
PV Watts is a useful tool for examining the tradeoffs involved. The software predicts the power produced from a PV system under various configurations. If a sunny location like Albuquerque, New Mexico is selected, the software indicates a single-axis tracker would produce about 20 percent more energy compared to the same size (Wdc) optimally oriented/tilted fixed PV system. But the story is deeper than that. A tracking system will also produce more energy when a utility most wants it -- when electric demands are at their peak.
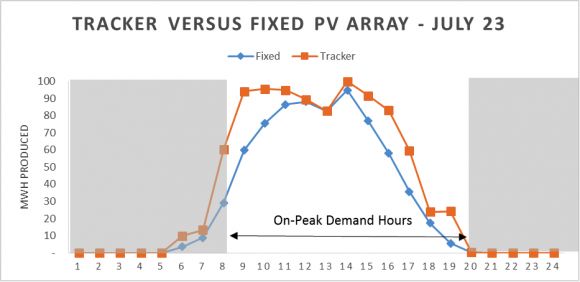
Take, for example, the following hourly simulation of power production on a July day in Albuquerque. The maximum production in hour 14 was set to 100 megawatt-hours. Notice how much more the tracker is producing during “on-peak” hours 8, 9, 10, and hours 15, 16, 17 compared to a fixed mounted PV system.
In hour 13, the tracker and fixed system are forecasted to have nearly the same output, because they are essentially operating at the same orientation at “solar noon.” There was also a cloud event in that hour which would diffuse the sunlight. That raises an issue with a fixed system versus one with trackers -- in cloudy areas, the benefits of trackers can be diminished due to the sunlight being scattered from clouds.
Source: PV Watts
Trackers will typically add additional upfront costs of 2 percent to 10 percent on large utility-scale projects. Recouping that added investment, however, will be location-dependent. Generally speaking, single-axis trackers produce about 20 percent more energy compared to fixed-mount systems just about anywhere in the U.S. However, the amount of annual energy produced in a cloudy location like Seattle is only about 60 percent of a sunny area like Albuquerque, which will greatly impact the economic analysis.
One hurdle for trackers is an outdated perception of added maintenance requirements or lack of reliability. But that is an image of the past, as more mature tracker manufacturers are reporting 99.99 percent uptime with gigawatts' worth of installations. Some recent innovations include simplified designs that have fewer motors, self-calibration, and no required routine maintenance.
The utility-scale PV market is taking off
Turn the clock back just five years to a time when solar power was largely viewed as a curiosity in the utility industry. Solar costs were multiples higher compared to its renewable competitor, wind energy -- so high, in fact, that some states made special carve-outs for solar in their renewable portfolio standards (RPS) so that solar would not be left out.
What a difference five years makes. The installed cost of solar has steadily dropped, positioning it to be the lowest cost renewable energy source available for many parts of the U.S. The following cost per watt (AC) graph was generated by Go Solar California, which has a database of all customer-installed solar projects, illustrating the dramatic drop in the installed cost of solar.
FIGURE: Dollars per AC Watt Quarterly Average in California
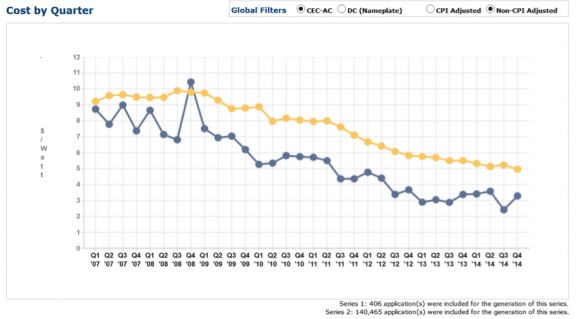
Source: Go Solar California
Since 2007, the installed price for smaller PV systems (under 0.5 megawatts) has dropped from around $10 per watt AC to around $5. The cost for medium-size systems (0.5 to 1 megawatts) is about 60 percent of the cost of smaller systems, around $3 per watt AC today. Even larger PV tracking projects over 25 megawatts in size are now being installed for under $2/watt AC.
With the drop in solar costs, installations have soared. The U.S. solar market is more than six times bigger than it was in just 2010. The good times are expected to continue, with a forecast of 12 gigawatts of PV installed in 2016 as companies rush to take advantage of expiring tax credits. The soaring growth has in large part been driven by utility-scale systems, of which annual installations increased from near zero in 2009 to 4 gigawatts in 2014, and are forecasted to be around 7 gigawatts in 2016.
However, 2017 may bring a dramatic drop in PV market size. With the help from better tracking technologies, hopefully solar will continue its downward trajectory in costs to offset the reduction in the federal Investment Tax Credit.
With the continued improvement in performance and cost of all major components including modules, trackers, and inverters, it appears utility-scale solar is here to stay and is positioned to be a very competitive source of electricity going forward.


 41
41
 15
15
 9
9