Since Mark Ferron retired from the California Public Utilities Commission in January, he has been free to say what he really thinks about the utility industry’s opposition to customer-owned solar PV, calling it an attempt to “strangle rooftop solar if they could.” Now he’s taking aim at the state’s grid regulator, California ISO, and its well-known -- and, Ferron says, misleading -- “duck curve” chart.
In fact, Ferron is so incensed at how CAISO’s chart accentuates the negative aspects, and disregards the positive effects, of the state’s growing share of distributed solar, that he’s calling on the solar industry to start gunning it down.
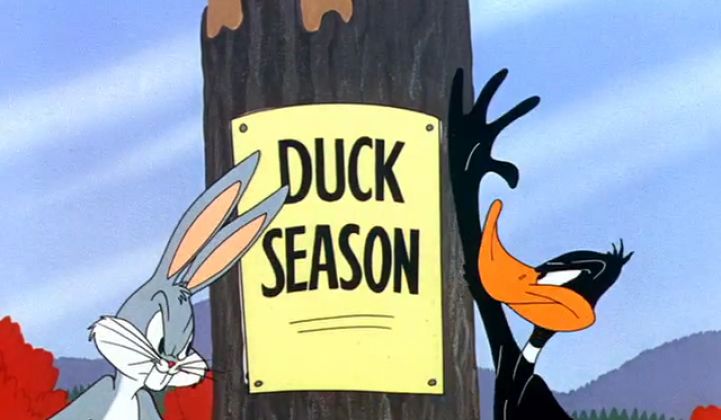
“We need to declare hunting season on the Cal ISO’s duck chart!” Ferron said Friday at the nonprofit group Vote Solar’s annual Equinox fundraising event in San Francisco. Judging from the cheers he got from the pro-solar crowd, he’s not the only one who wants to see the chart shot out of the skies of the policy debate on the state’s solar-powered future.
CAISO’s duck chart has gotten a lot of coverage as a representation of how massive amounts of customer-sited PV systems could wreak havoc on the state’s grid supply-demand balance. It describes a worst-case scenario: a sunny yet cool spring or autumn day on which distributed PV generation drives energy demand down to unprecedented lows at midday, because air conditioning loads aren’t sucking up the same amount of electricity that they do on hot summer days.
Reducing energy supply for that “belly” of the duck would require the state’s big generation fleet to crank down their production to inefficient lows. Hawaii’s isolated and solar PV-rich grid is already seeing some days when demand drops below zero because of how much solar power is being put onto the grid, something the state’s utilities and regulators have dubbed the “Nessie curve” after the legendary Loch Ness monster.
But in the late afternoon of this hypothetical day, while solar PV generation is falling away and California residents are coming home from work to turn on their lights, TVs and other household appliances, that demand will ramp up at an unprecedented volume, requiring a lot of flexible generation capacity to come on-line very quickly to meet that demand. That “neck” of the duck could overwhelm the capacity of the state’s generation fleet, and this potential outcome is pushing regulators like CPUC and CAISO to consider a new set of “flexible capacity” resources to manage it.
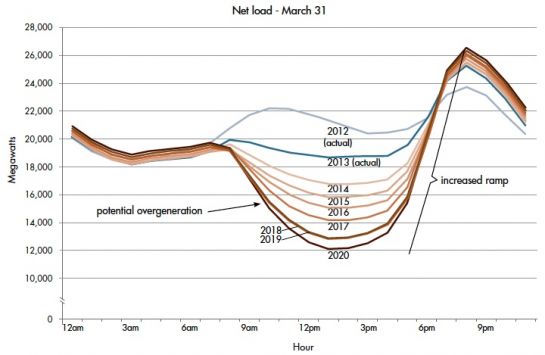
The problem with this vision is that it “assumes the worst of a number of parameters,” Ferron told me in an interview at Friday’s VoteSolar event. First of all, it’s taking a snapshot of a rare combination of sunny skies and cool temperatures. Those conditions aren't out of bounds -- grid operators like CAISO have to plan for these kinds of worst-case scenarios, since they’re tasked with making sure the grid remains stable under all kinds of contingencies.
But beyond that, the duck curve “assumes that people don’t adjust to prices, that they don’t adjust to incentives,” he said. In other words, it doesn’t take into account the time-of-use pricing being rolled out across the state, the energy efficiency to come from new building codes and programs, or the potential for demand response to automatically adjust household or commercial building energy use to meet grid imperatives.
To get a good idea of how new energy regulations and economic models could flatten out the duck curve, Ferron suggested reading “Teaching the Duck to Fly,” a white paper (PDF) from the Vermont-based Regulatory Assistance Project. Here’s a graph from that white paper, indicating how a set of strategies could help solve the duck curve’s deep-belly, steep-neck problems:
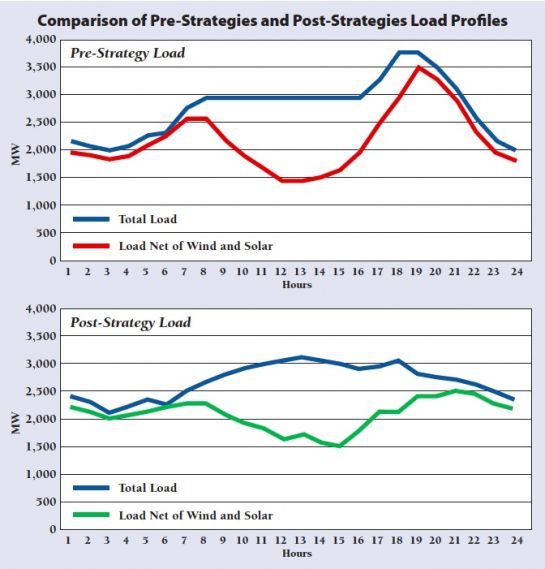
The strategies laid out would require some significant alterations to the way utilities and consumer interact. For example, it calls for the flexibility to ask demand reduction and load control programs typically triggered only during the hottest peak summer days to be dispatchable during the late afternoon/early evening “ramp” times represented by the duck curve. It also calls for orienting solar panels from south to west, so they capture more late afternoon sunlight, while foregoing greater overall generation.
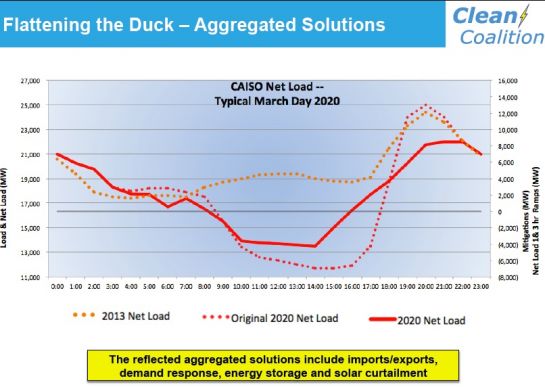
The Clean Coalition, a California-based energy policy nonprofit, has also tackled this challenge in its “Flattening the Duck Curve” paper (PDF), which incorporates ongoing California policies like the state’s smart inverter regulations and statewide grid energy storage mandate.
All of these solutions are within the realm of possibility for California’s utilities and regulators, Ferron said. “The problem is the policy framework that favors the status quo over sustainability and consumer choice,” he said. Instead of embracing these changes, utilities “have perfected the art of slow-walking when it serves their interests.”
That’s an opinion we’ve seen taken up by green power and environmental advocates calling for no new natural gas-fired power plants to replace Southern California’s now-closed San Onofre nuclear power plant. Nor are state regulators ignoring these issues. The CPUC’s decision on how to meet Southern California’s post-San Onofre power needs incorporates a lot of green alternatives, along with the potential for new gas-fired power plants, and CAISO is in the midst of creating new methods to bring demand-side resources into account for grid reliability planning.
But for solar advocates, there’s plenty of other evidence that utilities are stonewalling the progress of clean, distributed power. Take the state’s big three investor-owned utilities’ current stance on requiring expensive and lengthy applications for connecting energy storage systems to customer solar PV, or their opposition to increasing the scope of the state’s net metering program.
Meanwhile, California’s grid continues to set records for solar capacity nearly on a weekly basis, all without major disruptions. That doesn’t prove that the future won’t hold more disruption to come, of course. But it does indicate that the state is moving toward a much more renewable-centric energy model -- whether or not utilities and regulators are ready for it.


 41
41
 15
15
 9
9