
As distributed solar gains popularity across the U.S., utilities are struggling to keep up with interconnection requests for small systems, according to a new study from EQ Research.
The average wait time for a small solar PV system (defined as 10 kilowatts or below) to receive permission to operate from a utility nearly doubled from 2014 to 2015, to 45 days up from 28. The average "permission to operate" wait time per utility rose by more than 100 percent.
It took the U.S. decades to get to 1 million solar installations, but it will take only two years to get to 2 million, according to the Solar Energy Industries Association. While small systems make up only a fraction of the total installed PV capacity, they make up the majority of installations by volume.
There are problems with interconnection procedures in many states for both large and small distributed energy projects, most of which are solar. Leading solar states like California, New York and Colorado have streamlined the process for small projects while still refining the process for large projects. On the latter issue, some states are further along than others.
FIGURE 1: State Rules Setting Interconnection Timelines for Systems 10 Kilowatts or Smaller
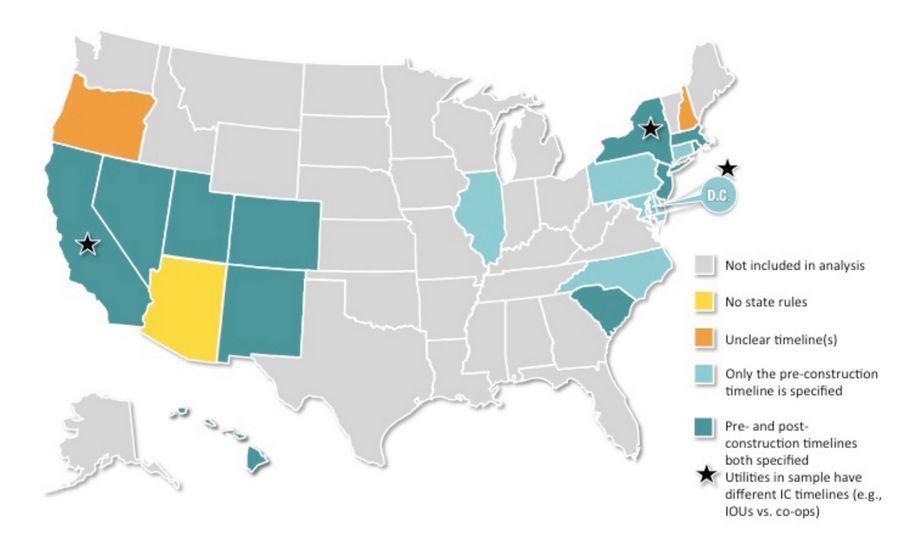
Source: EQ Research
Many states still have a long way to go for even small projects, according to the new research from EQ. The study collected data for 62 utilities with the highest amounts of residential PV customers, covering 20 states and Washington, D.C.
There was huge variation among utilities, even within states. Pre-construction wait times varied from one day for Ameren Illinois to 75 days at Maui Electric Co. The average was 18 days, up from 14 in 2014. Even in California, the leading solar market in the U.S., many utilities saw pre-construction application timelines increase.
The wait times for permission to operate are even more considerable. Only five of the utilities in the report had wait times under 10 days -- two of those were Illinois utilities, Commonwealth Edison and Ameren.
And because utilities and developers have pre- and post-construction timelines, the wait times for operation can still be considerable. Both Colorado and California had multiple utilities with wait times for permission to operate of more than three months.
FIGURE 2: 2015 Utility PTO Timelines, in Days (More than 2 Months)
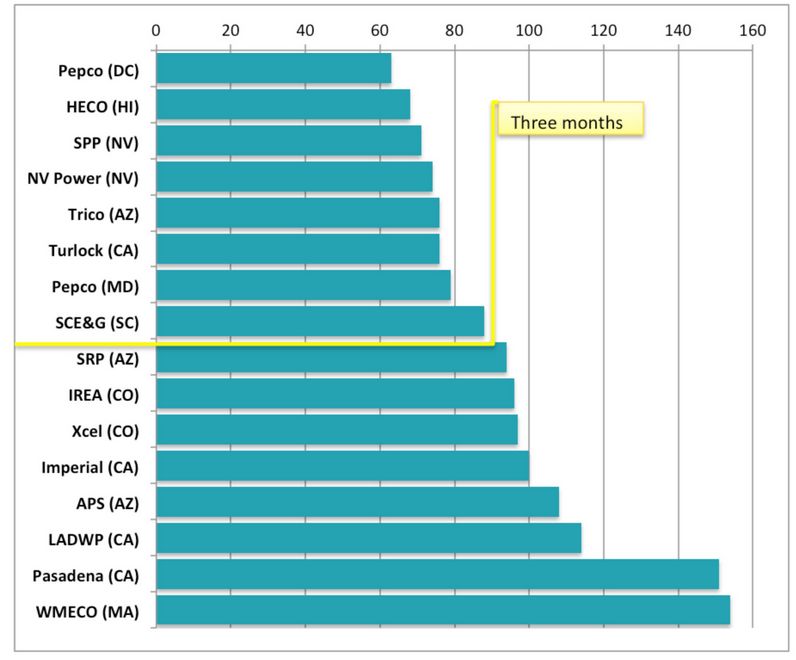
Source: EQ Research
The expanding wait times are mostly because utilities are inundated with more requests than before; some utilities do not even have online application procedures. A select few of the utilities have responded to the onslaught of applications with more denials. PECO, for instance, has seen a thirteenfold jump in applications from 2015 to 2016, according to the report, and now more than one-quarter of applications are being denied due to grid capacity issues.
The PECO situation is relatively unique, but there is still a need for more transparency in the interconnection process for developers large and small to understand where there is congestion on the grid. In some cases, utilities and states are not using the most up-to-date technical specifications for evaluating grid capacity, which can lead to denials where they could have been accommodated.
The past year may have been the year where it got worse before it could get better, but improvements are being made. Utilities are investing in online application procedures and staffing up, while regulators and legislators in many states are imposing timelines for interconnection procedures. As of the report’s filing, however, Massachusetts remains the lone state that creates specific financial penalties for utilities that fail to meet the interconnection timeframes.


 41
41
 15
15
 9
9