This is the second piece in a series on the balance-of-system (BOS) tracker market from GTM Research. To read part one, click here. To learn more about the larger BOS market, its technology costs, leading players and market outlook to 2016, click here.
Operations & Maintenance (O&M) Cost
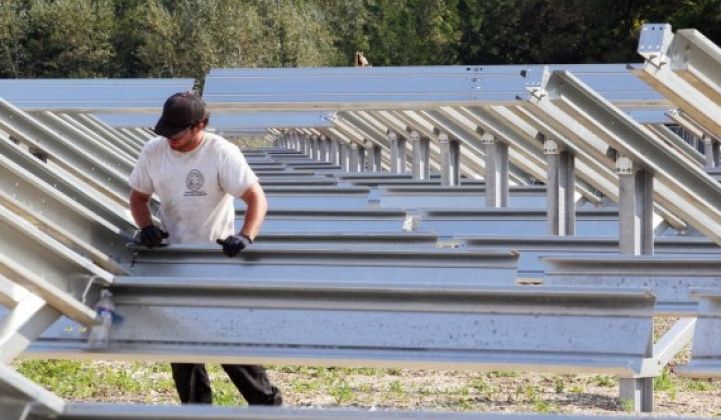
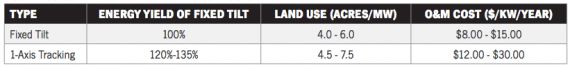
Tracking systems require more maintenance and, simply by virtue of having more moving parts, are more likely to malfunction. In areas with high labor costs, this can have a meaningful impact on project economics. O&M costs for 1-axis tracking can be as much as $0.01/Wp more than traditional fixed-tilt systems.
However, tracker manufacturers like to remind skeptics that the duty cycle for tracker motors is a fraction of their capability. In response to the claim that trackers increase maintenance, a prominent tracker manufacturer remarked, “Nearly every home today has appliances with motors. Examples are washing machines and refrigerators. These systems are very reliable, and there is an infrastructure for O&M. Furthermore, solar trackers now have over a decade of operating experience. Note that solar trackers only turn one revolution per day. This equates to 7300 revolutions in twenty years. By analogy, with a simple wristwatch, this equates to the number of revolutions the second hand on a watch will make in 121.6 hours, or five days. Thus, the argument that trackers cost more to maintain is slowly fizzling out with the increasing number of deployed tracker systems operating well.”
FIGURE: Comparison of Fixed and Tracking Systems
Source: Solar PV Balance of System (BOS) Markets: Technologies, Costs and Leading Companies, 2013-2016
End-User Considerations
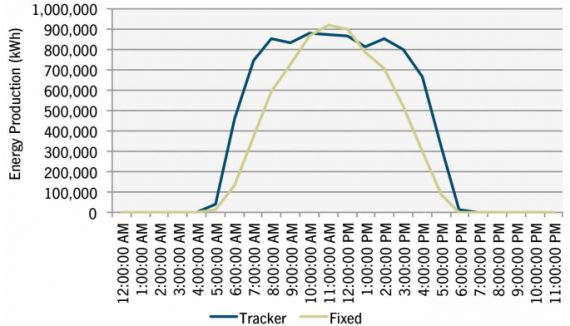
The figure below shows the power curves of a fixed project and a tracking project located in Phoenix, Arizona. Tracker systems produce more energy later in the day than fixed systems. Utilities need energy from PV systems late in the afternoon, especially during summer, to help reduce peak loading costs as homeowners return from work and fire up air conditioners, ovens, televisions, etc. Trackers provide energy to utilities when they need it most. That is reflected in some markets by the use of TOD pricing.
FIGURE: Energy Production Comparison, Fixed-Tilt vs. One-Axis Tracking
Source: Solar PV Balance of System (BOS) Markets: Technologies, Costs and Leading Companies, 2013-2016
Time-of-Delivery or Time-of-Day (TOD) Pricing
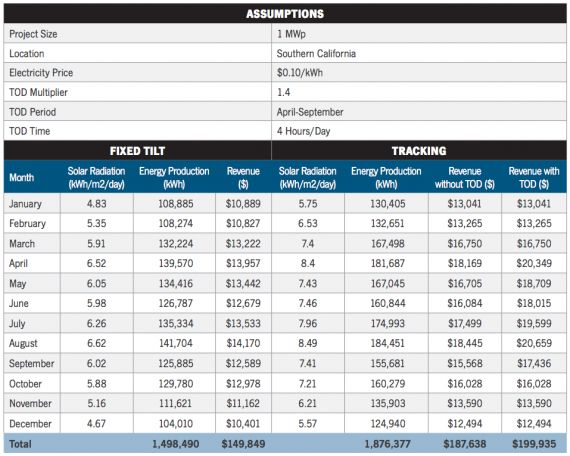
One of the major benefits of tracking systems is their ability to maximize generation during peak hours in the late morning and early evening. California utilities SCE and PG&E, for example, offer average TOD factors of between 1.25 and 1.30. In other words, PV projects in California receive an average of 25 percent to 30 percent above the base power purchase agreement (PPA) price as a result of peak generation. However, not all PPAs include TOD factors in their rates. Where TOD rates are available, tracking systems will maximize this benefit. The following figure explains the benefits accrued from the TOD factor.
FIGURE: Revenue Impacts of Fixed-Tilt Versus Tracking Systems
Source: Solar PV Balance of System (BOS) Markets: Technologies, Costs and Leading Companies, 2013-2016
A tracker system in a location with TOD pricing can generate up to 33 percent increased revenue over fixed-tilt systems. In the non-TOD locations, this differential is 25 percent over fixed-tilt systems.
Geographical Factors
- Soil type: Some soil types do not allow for the mounting rack to penetrate the ground (due to the pH level in that particular site), leading to a ballast system installation and hence a different cost structure.
- Wind loading has a significant impact on the design when higher-gauge steel is needed in order to prevent the system from damage. Many systems go into “stow” position when wind speed exceeds certain limits in order to prevent the damage of the system/modules.
-
Irradiance: Irradiance from the sun is another determining factor that affects whether tracker or fixed-tilt systems should be selected for a specific project. The chart below illustrates the energy harvest in different locations compared with the percentage increase in energy harvest when using a 1-axis tracker. As is evident from the chart, there is a significant correlation between higher irradiance and the increased energy harvest when 1-axis trackers are used.
FIGURE: Energy Harvest, Fixed vs. One-Axis Tracking
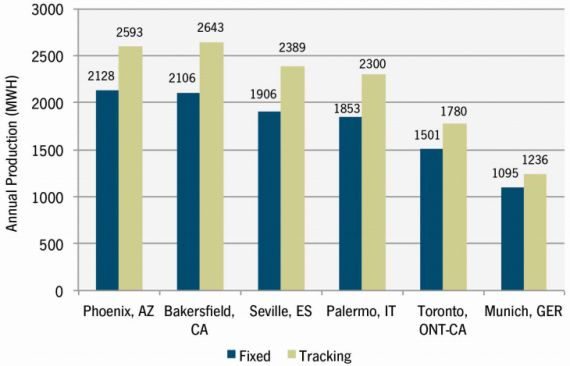
Source: Solar PV Balance of System (BOS) Markets: Technologies, Costs and Leading Companies, 2013-2016
In summary, the choice between a fixed system and a tracking system is by no means simple. Cost, utility rate structure, conversion efficiency, land availability, and geographical factors must all be taken into account and compared against each other before a decision can be reached. In most locations, each system type will carry some benefits relative to the other, and developers will need to weigh the importance of each characteristic.
However, a few conclusions can be reached from this analysis. Energy harvest in high insolation areas is markedly improved using a single-axis tracking system. Previous to the free-fall in crystalline module pricing, for areas such as Arizona and New Mexico, with high temperatures, high availability of land, and no TOD factor in PPAs, fixed-tilt projects with lower efficiency modules (e.g., CdTe) had an advantage in terms of energy harvest, as well as capital cost. The cost advantage has been weakened with the current comparability of thin-film and crystalline module pricing. Thin film companies are searching for alternatives to increase value to clients.
We feel that the move toward thin film on trackers has been accelerated, perhaps before tracker technology is actually ready, because of the downward pressure on module pricing, thus the need to innovate and provide value to clients that can no longer be provided by competitive pricing. Nevertheless, each project will tailor its technology and mounting selection to the needs of the individual site and power purchaser.


 41
41
 15
15
 9
9