As the world grapples with the unfolding human and economic toll of the coronavirus pandemic, keeping the electricity system running has become more important than ever. It's also become more complicated than ever.
Over the past month, quarantines have closed down large swaths of the global economy and forced millions to shelter and work at home. These disruptions are causing dramatic shifts in energy-consumption patterns and forcing utilities and grid operators to adjust both their day-to-day operations and long-term plans.
It's hard to predict how long these changes will last or how deeply they will alter the ongoing operations of utilities and grid operators across the country. But the past few weeks have provided some data that can help utilities and grid operators prepare for what's coming.
Why Europe’s loads are falling faster than America’s — so far
Last week, we covered the dramatic fall in Italy’s power demand as the country experienced a near-total shutdown to grapple with Europe’s worst COVID-19 outbreak to date. Power demand fell 8.1 percent week-on-week and 7.3 percent year-over-year after the country instituted a countrywide lockdown on March 13.
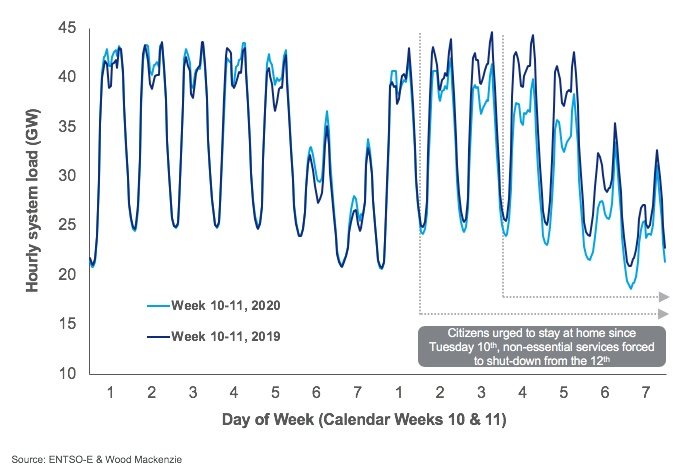
Peter Osbaldstone, Wood Mackenzie’s research director for European power and renewables, tracked similar declines across European countries in a March 18 report, with hard-hit Spain falling 5.6 percent from the previous week, the U.K. falling 4.7 percent, and France, which relies on electricity for almost all its residential heating needs, falling 9.7 percent. He warned those declines could accelerate as lockdowns become more widespread, with industrial and commercial demand particularly hard-hit.
The utility-funded Electric Power Research Institute (EPRI) reported even greater declines in a March 27 report, with Italy seeing a 10 percent to 21 percent reduction in peak demand and energy use in the first week after its national lockdown.
In the United States, the states that have undergone the earliest lockdowns and worst outbreaks have seen less aggressive declines, EPRI reported — a finding backed up by reports from state grid operators.
In California during the week after the statewide shutdown, state grid operator CAISO has reported load reductions of 5 to 8 percent on weekdays and 1 to 4 percent on weekends. In New York, the epicenter of the country’s COVID-19 outbreak to date, grid operator NYISO has reported a 2 to 3 percent drop in energy use in the week before the state’s full lockdown, and a drop between 4 to 5 percent in the week after the lockdown.
This difference can be explained by a number of factors, Aidan Tuohy, program manager of grid operations and planning at EPRI, said in a Thursday interview. First, the U.S. is roughly a week behind Europe in experiencing the worst effects of the outbreak. That means Europe’s experience may provide a preview of what’s to come in hard-hit states.
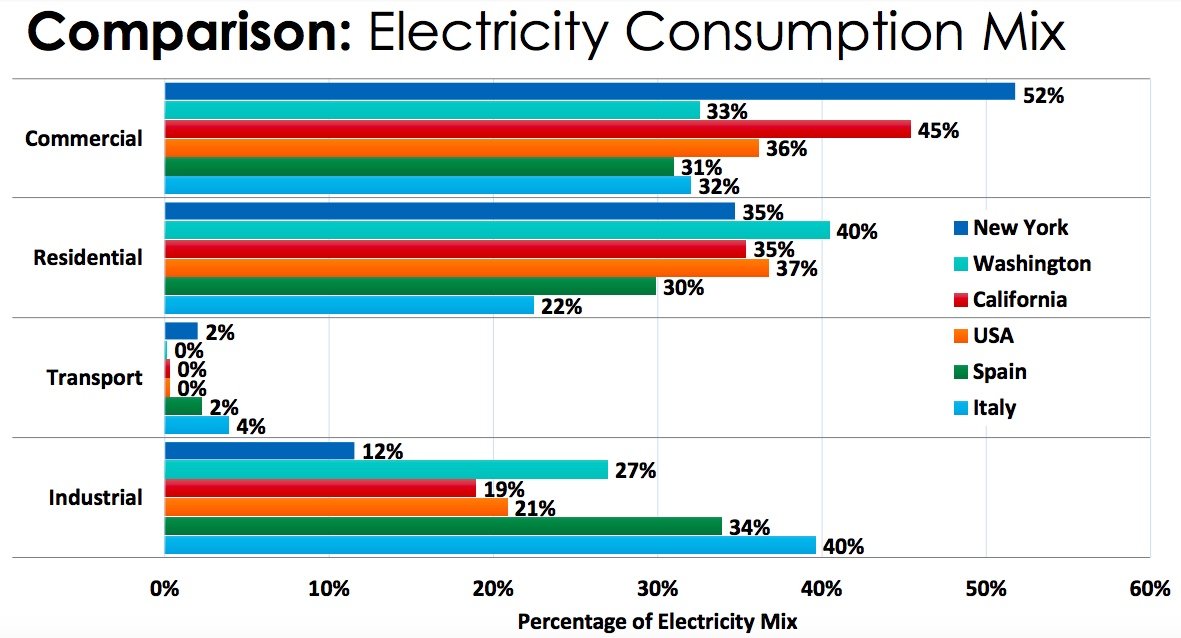
There are also key differences in how electricity is used between Italy and Spain and key U.S. markets, he said. “The underlying load mix in Italy is quite a bit different,” with the industrial sector using a much larger share of electricity and its commercial and residential sectors much less compared to California and New York, as this chart indicates.
U.S. power demand will likely continue falling in the weeks ahead as the economic harm of the coronavirus spreads and more businesses close. While residential demand has been rising in California under stay-at-home restrictions, it hasn’t increased as much as commercial and industrial demand has fallen, CAISO reported this week.
Challenges for utilities and grid operators
Thankfully, falling energy demand doesn’t stress the grid the way that excess demand does. CAISO and NYISO, along with other U.S. grid operators, have continued to report no underlying threat to grid reliability.
Still, there are problems that can emerge if demand falls too low, which is something EPRI is studying, Tuohy said. “We want to know how peak is changing — but also how minimum demand is changing.”
Springtime is typically when many grids touch their yearly minimum demands. While those minimums aren’t falling dramatically below typical levels, “we are seeing them being reached more frequently,” he said.
This can be a problem for grid operators, particularly those that rely on renewable energy for a significant portion of their power, Eamonn Lannoye, senior program manager for EPRI Europe, said in a Thursday interview. “At lower demand levels, some transmission and distribution systems are seeing higher voltage issues and taking mitigation actions.”
Grids with high levels of renewables are particularly sensitive to low demand conditions, Lannoye said. “I live in Ireland, and here, demand has gone down a little bit, but not a lot, because we have a lot of data centers. But we have a lot of renewable generation at levels of lower demand.”
Ireland’s massive and growing share of wind power has led the grid to struggle to maintain reliable frequency at times when that inverter-based generation exceeds that from power plants that provide inertial stability. In that way, minimum-demand conditions presage the kinds of problems that other power grids striving to increase their share of renewables will face in years to come, he said.
Paul A. DeCotis, senior director at West Monroe Partners, noted another challenge that could arise with the falling demand and changing load patterns occurring under coronavirus lockdowns. “This will require different buying patterns in the wholesale energy markets,” he said. “There’s little history for this, so there’s nothing to fall back on. It requires constant monitoring of the market to observe shifts in load.”
Different classes of utility will face different levels of exposure to this risk, depending on how much they own or control their own generation resources, DeCotis said. While vertically integrated utilities may be insulated from market uncertainty, “there could be a potential issue here for some of the local municipal utilities,” he said.
Many municipal utilities lack the financial resources of the large investor-owned utilities. But those that own generation assets or buy power directly from federal power agencies such as the Tennessee Valley Authority and Bonneville Power Administration will be more insulated than those largely reliant on wholesale energy markets.
In California, the community-choice aggregators (CCAs) that have taken over power procurement for utility customers in many cities and counties could face similar stresses. “One of our challenges now is predicting how much change is happening,” Nick Chaset, CEO of East Bay Community Energy, said on GTM’s The Interchange podcast last week. “It’s potentially very disruptive. We’re seeing a lot of price volatility in the short term, especially in California.”
Flattening the duck curve's belly
One of the biggest changes underway is a shift to residential customers as a primary source of electricity demand in some markets. The California Public Utilities Commission, which on Thursday announced several policies to reduce costs for low-income or unemployed customers, noted that residential demand has increased between 15 to 20 percent over the past two weeks.
This shift from workplace to homes is likely to alter the usual shape of load curves, both by reducing the amount of energy consumed by the commercial sector during regular working hours and potentially lowering the ramp in household demand that typically occurs after working hours, West Monroe’s DeCotis said.
“The peaks may be less peaky, and loads might be more evenly distributed” as homes use energy throughout the day, rather than turning most household loads from off to on after coming home from work.
Just how this change in behavior might play out across different regions with different mixes of resources is hard to predict. But in Austin, Texas, a long-running home energy data collection project run by the Pecan Street research organization might offer some insight into its implications — including how it could shift the effects of rooftop solar PV on the grid.
This week, Pecan Street released preliminary results from an analysis of the second-by-second data it’s been collecting from the 121 homes — all but two of them equipped with rooftop solar — that it has been monitoring for nearly a decade in Austin’s Mueller neighborhood.
While Texas hasn’t instituted a statewide stay-at-home order, the city of Austin and surrounding Travis County ordered their residents to shelter in place on March 24. That’s provided Pecan Street with a snapshot of how the people living in these solar-equipped homes have changed their energy consumption patterns before and after the order, and what effect that’s had on the typical “duck curve” shape of their daily demand profile.
The "duck curve" is a term coined by CAISO to describe how solar power floods the grid during daylight hours, pushing down demand curves, and then fades away in late afternoon and evening, causing steep peaks in demand as people come home from work and start using energy again. While California’s duck curve is primarily driven by utility-scale solar, it can also be observed at an individual home, with solar power sometimes exceeding household demand and feeding power back to the grid.
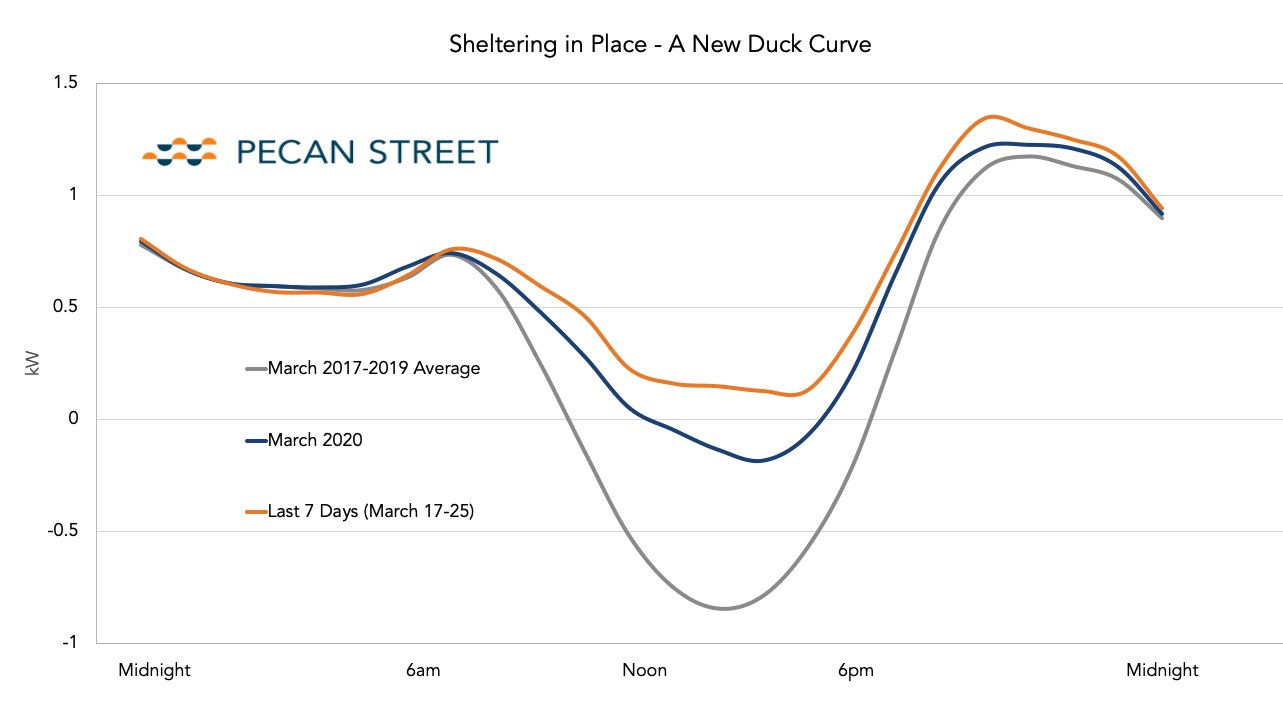
Pecan Street’s data indicates that, since Austin’s stay-at-home order was put in place, the “belly” of that duck curve has been raised significantly as people consume more of their self-generated solar power. While the data is still preliminary, “the way the demand curve has shifted upward certainly goes toward flattening that belly,” Pecan Street CTO Scott Hinson said in a Thursday interview.
“We think that’s an impact of folks staying home and using more of that energy locally, instead of letting it flow back onto the grid.”
Texas, which has only a few municipalities including Austin that offer net metering or other incentives for homeowners to install solar, has a tiny residential PV market compared to states like California. But the data from Pecan Street demonstrates that stay-at-home orders may yield a solar-equipped-home demand curve that’s noticeably different from the norm.