A recent study of solar found that a properly calculated levelized cost of electricity (LCOE) is now competitive, and an LCOE presentation by Lawrence Berkeley National Laboratory (LBNL) researchers confirmed that wind is now at $33 to $65 per megawatt-hour and falling.
As with solar, the key to the accurate price of wind is reconciling numbers with facts. Learning curve theory, said LBNL researcher Mark Bolinger, predicts that wind price should have dropped 20 percent to 30 percent as installed capacity doubled twice between 2002 and 2008. But turbine cost, which is 50 percent to 60 percent of LCOE and 60 percent to 70 percent of project cost, doubled.
To understand this phenomenon, Bolinger and fellow LBNL researcher Ryan Wiser studied the four endogenous factors (labor costs, warranty provisions, profitability, turbine design/scaling) and three exogenous factors (raw materials prices, energy prices, foreign exchange rates) that determine turbine price.
It is a detailed study. A turbine’s main raw materials, it reports, are steel (66 percent to 81 percent), iron/cast iron (9 percent to 13 percent), copper (1 percent to 2 percent), and aluminum (0 percent to 1 percent).
The learning curve theory contradiction, they found, is that “the largest single impact -- from scaling -- brings LCOE benefits.” Large-scale turbines allow wind projects to perform better. This “tradeoff between capital cost and performance” means that “LCOE is likely a better indicator of ‘technology learning’ than is capital cost,” the researchers reasoned.
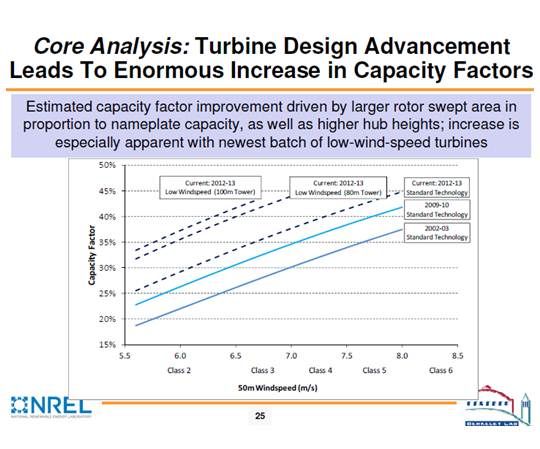
Wiser looked closer at the relationship between capital cost and capacity factor. An “exclusive focus” on “individual factors,” Wiser said, “fails to understand the interdependency between capital costs and capacity factors,” whereas developers “would be willing to accept a higher capital cost if the improved performance resulted in a lower LCOE.”
Wiser’s analysis, which includes wind’s production tax credit (PTC) and depreciation provisions but not other factors such as transmission costs, showed wind capital costs were lowest from 2002 to 2003, rose slowly to a peak in the 2009-to-2010 period, and have fallen since, promising lower project costs in the 2012-2013 period.
Trends like “[t]urbine costs bending downward” and “fleet-wide capacity factors leveling off” might suggest, Wiser said, that the wind industry has “matured to the point that learning-related cost reductions are no longer the rule,” but “those trends fail to tell the whole story.”
Because bigger, better wind turbines have significantly better capacity factors, projects are increasingly located in lower wind-speed locations that belie the real capacity factor. The better capacity factor, which is created largely because of greater hub heights, larger rotor diameters and more efficient power electronics, can also be concealed by increasing curtailment of productive projects due to a lack of transmission capacity.
“We’re not running out of higher wind-speed locations,” Wiser said, “but we may be running out of those high wind-speed locations that have ready access to existing transmission and lack substantial siting and permitting barriers.”
Projects were most commonly sited from 1998 to 2001 in class 4 or class 5 wind regions, whereas from 2006 to 2009, it was in class 3 to class 4 wind regions.
Due to the capacity factor/capital cost interdependency, as well as to falling turbine costs, falling operations and maintenance (O&M) costs, an increased turbine supply, and lower cost financing, Wiser said, “the delivered levelized cost of wind energy has declined substantially in recent years.”
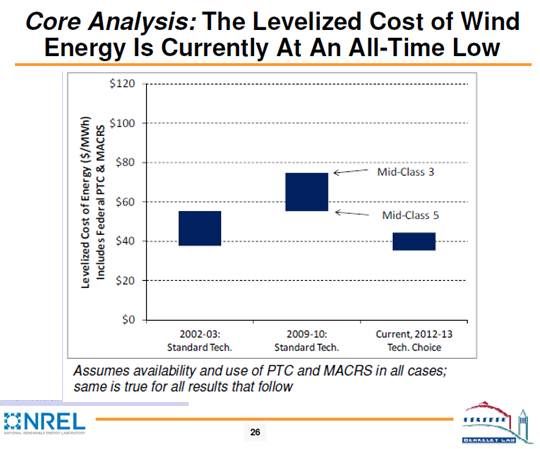
The LBNL analysis incorporated multiple studies, hundreds of projects and detailed data from Vestas, GE, and other manufacturers. It focused on five GE turbines, one from 2002-2003 (installed capital cost: $1,300/kilowatt-hour), one from 2009-2010 ($2,150/kilowatt-hour), and three planned for 2012-2013, appropriate to varying wind speeds ($1,600, $1,850 and $2,025/kilowatt-hour).
“Turbine design advances,” Wiser said, “have led to an enormous expected increase in the expected project-level capacity factors within individual wind resource areas,” adding, “LCOE “is now at an all-time low across all wind speeds.”
Just the opening up of low wind-speed areas (alleviating some transmission and siting barriers), according to Wiser, produces a 5 percent to 26 percent LCOE reduction.
“Assumed improvements in O&M costs, financing rates, and availability lead to substantial additional estimated LCOE reductions,” Wiser found, "of 24 percent to 39 percent.”
“Two countervailing factors may intervene to raise LCOE,” Wiser concluded: more “lower wind-speed sites as a result of severe transmission/siting limitations” or the “loss of federal PTC/ITC/Treasury Grant” incentives.
Realizing the wind industry goal of providing 20 percent of U.S. power by 2030 at the predicted price of $1,238/kilowatt-hour, Eric Lantz of the National Renewable Energy Laboratory noted, “Assuming costs of $70/megawatt-hour, excluding incentives and policy, for a mid-class 4 wind regime, the potential future cost for a similar wind regime can be approximated at $40 to $70/megawatt-hour, with most estimates falling between $50 and $55.”
The Lantz estimate considered multiple ranges of declining costs and increasing outputs, as well as technology advances in blades, towers, drivetrains, manufacturing, power electronics (PE) costs, array losses, and PE efficiencies.
Lantz concluded that scaling for onshore turbines to a 3.5-megawatt size is most likely. A 5.0-megawatt scale is challenging. But Lantz acknowledged being unable to predict disruptive technologies or drivers that might produce them.
Nevertheless, “if existing prototypes and recently commercialized equipment prove viable,” Lantz concluded, “cost reductions are likely to come sooner than we think.”


 41
41
 15
15
 9
9