The solar eclipse that crossed the United States on Monday may have cast its shadow over large swaths of solar PV from California to South Carolina. But with an effect that’s even more predictable than the weather, grid operators across the country were able to manage their way through multi-gigawatt dips in solar generation without any worries about keeping the grid itself stable.
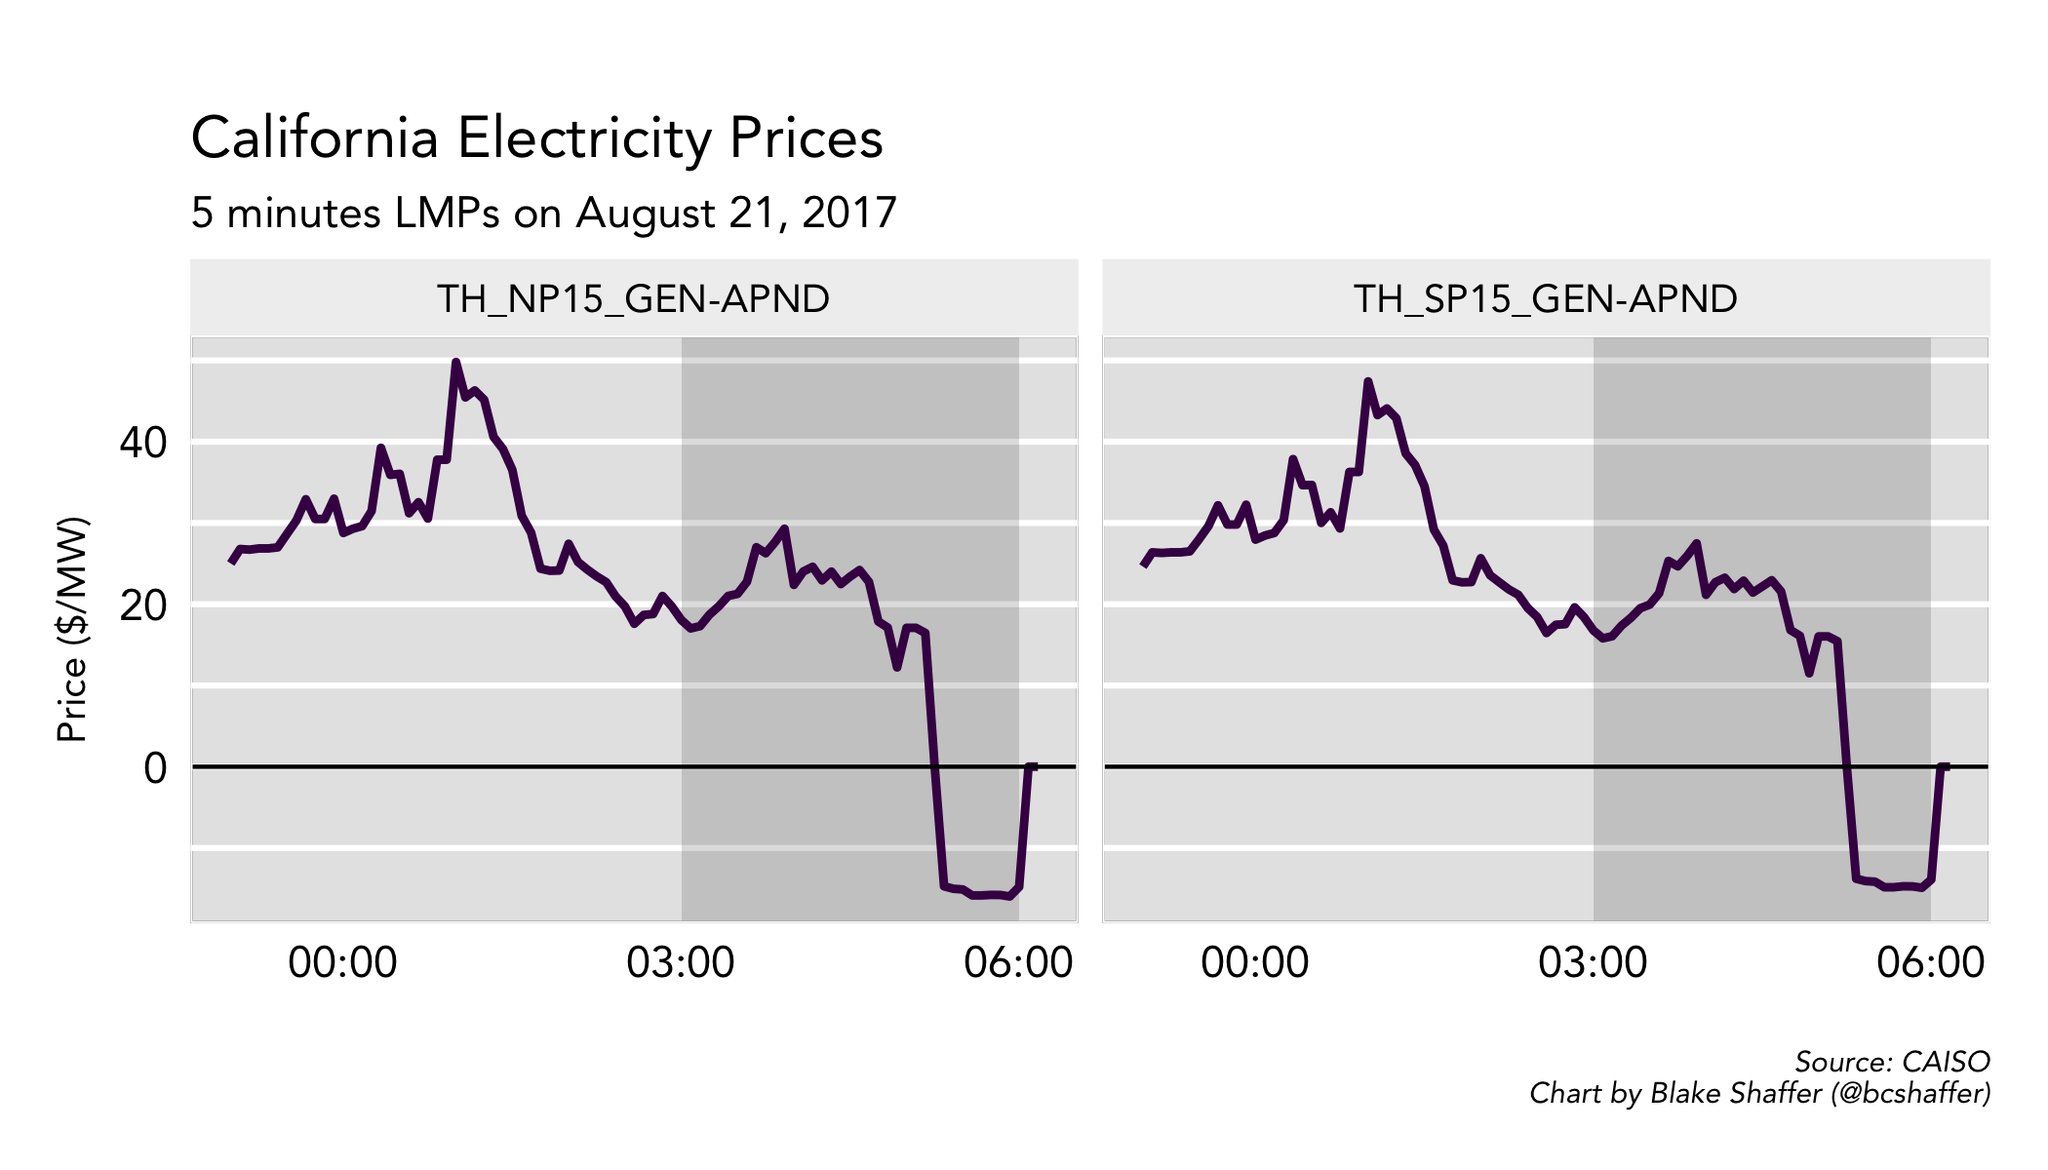
That doesn’t mean that the price for megawatts on the energy markets run by grid operators remained stable through the event, though. In California, solar production fell off a cliff, dropping about 3,500 megawatts from 9 a.m. to 10:30 a.m. -- and the price of energy spiked from about $25 to more than $50 per megawatt-hour.
Then, as the eclipse passed and solar power returned, the surge of energy coming onto the grid pushed prices down past their starting point, and then into negative territory -- forcing generators to pay the market to take their excess power, and driving those that have some flexibility to curtail output, bringing supply and demand back into balance.
Here's a chart from Blake Shaffer, a former energy trader and economics doctoral candidate at the University of Calgary, showing the 5-minute shifts in prices per megawatt-hour during the day of the eclipse.
But this kind of day-by-day swing in solar -- and wind, and hydro -- isn’t unusual for CAISO. To be sure, the continent-wide scope of the eclipse's shadowing effect is unusual. But California can see similar swings in solar from the burn-off of coastal fog in mid- to late morning, or from the wind and clouds coming in from the Pacific.
On the demand side of the equation, California still sees its peak loads in the summer, on hot days when air conditioning use spikes. But that demand actually tracks pretty well, though not perfectly, with the bell curve of solar PV power production -- assuming the hottest days are also sunny, which they almost always are in California.
Where solar and demand really get out of whack is on sunny but cool spring days, when there’s not enough air conditioning, or any other loads, to suck up the rising tide of solar power. That’s when California sees the “duck curve” emerge, with excess solar driving demand down through midday (the “belly” of the duck) then fading away in the afternoon, creating a steep ramp in demand (the “neck” of the duck).
This year has seen this oversupply driven further out of whack by must-run hydropower, putting CAISO in fear that it could see several days of conditions that call for emergency curtailment measures -- a last-ditch set of market controls to step in when negative pricing hasn’t done the trick.
That didn’t happen on Monday, which makes sense, given that CAISO and the rest of the country had years to prepare for the eclipse. In California's case, it readied itself to call on the gas-fired generators, which are the main source of ramping capacity to meet the state's increasingly sharp ramps in energy demand. For the eclipse, CAISO prepared for a drop-off of 70 megawatts per minute, and a ramp-up of about 100 megawatts per minute, compared to a typical 29 megawatts-per-minute ramp between 9 a.m. and noon.
California had two-thirds of the 9,000 megawatts of U.S. solar power that was shaded out by the passage of the moon between us and the sun, giving the rest of the country’s grid operators less to worry about. Texas grid operator ERCOT, for example, was expecting solar generation to drop by about 600 megawatts through the eclipse -- less than half of the 1,000 to 2,000-megawatt solar deficit it regularly handles on heavily cloudy days.
In the Pacific Northwest, which caught the eclipse first, the federal Bonneville Power Administration reported a similarly light impact on its hydropower-rich transmission system. In North and South Carolina, where the shadow of the eclipse ended its transcontinental track, Duke Energy lost about 1,700 megawatts of its 2,500 megawatts of solar, a similarly small portion of its overall load.
Solar makes up less than 1 percent of the generation mix for mid-Atlantic grid operator PJM, which reported a drop of about 520 megawatts of wholesale solar generation from pre-eclipse to its peak, along with another loss of about 1,700 megawatts from rooftop PV systems.
But while PJM had expected to see an increase in electric demand on the grid, it ended up seeing a net decrease of about 5,000 megawatts through the eclipse -- a shift it attributed to “reduced air conditioning, increased cloud cover and changes in human behavior related to the event."
This behavior includes people turning off lights, unplugging appliances and taking other energy-saving measures, either on their own or in response to eclipse-themed marketing and promotional efforts, like California’s media blast asking people to lower their electricity bills on eclipse day “and every day.”
But the community spirit that compels people to join in a shared effort during a rare event is harder to tap on a day-to-day basis.
The California Public Utilities Commission and utilities aren’t expecting customers to unplug big appliances every spring morning around 10 a.m., CPUC President Michael Picker noted in a post-eclipse interview.
However, the time-of-use rates that are coming to California customers between now and 2019 will begin to expose them to some of the pricing pressures -- and opportunities -- of a grid that’s increasingly powered by renewable energy, he noted.
Greentech Media’s U.S. Power & Renewables 2017 conference in Austin, Texas this November will provide a forum for delving into the complexities of new energy market challenges like California’s.
The two-day event will feature top regulatory, utility and technology leaders. It will also bring together the solar expertise of GTM Research, the wind energy analysis of MAKE, and the broader energy and utilities expertise of Wood Mackenzie, for an end-to-end view across the entire energy market value chain.
We'll be taking an in-depth look at how renewables are influencing U.S. power markets and how those interactions can impact overall industry development and market growth.


 41
41
 15
15
 9
9