
We’ve covered the growth of the duck over the half-decade since the term was coined by California state grid operator CAISO, named after the shape of a grid with midday solar bellies and steep evening necks in its supply-demand curve. This year has brought increasing proof that the duck curve has grown up, and much faster than expected.
The latest comes in this week’s report from the U.S. Energy Information Administration, based on CAISO’s net system loads and wholesale energy market prices over the past six months. In that time, average day-ahead hourly energy market prices during the 5 p.m. to 8 p.m. period -- the “neck” of the duck -- have spiked to nearly $60 per megawatt-hour, compared to about $35 per megawatt-hour in the same period in 2016.
There’s also a rising morning ramp in prices, one that’s actually higher than the prices of last year’s evening peak. At the same time, prices for the 9 a.m. to 5 p.m. period have fallen to near $15 per megawatt-hour, driven by the excess supply of solar, wind, and this year, hydropower. Steeper ramps and deeper bellies add up to a recognizable shape.

This average includes both the relatively moderate load curves of wintertime, and the cool spring days when solar was producing and the state wasn’t using air conditioning -- the season when the duck curve’s manifestations are felt the strongest. This spring witnessed a record-setting amount of negative pricing, as hydro, solar and wind power added gigawatts of excess energy to the system, forcing CAISO to curtail resources until demand picked up.
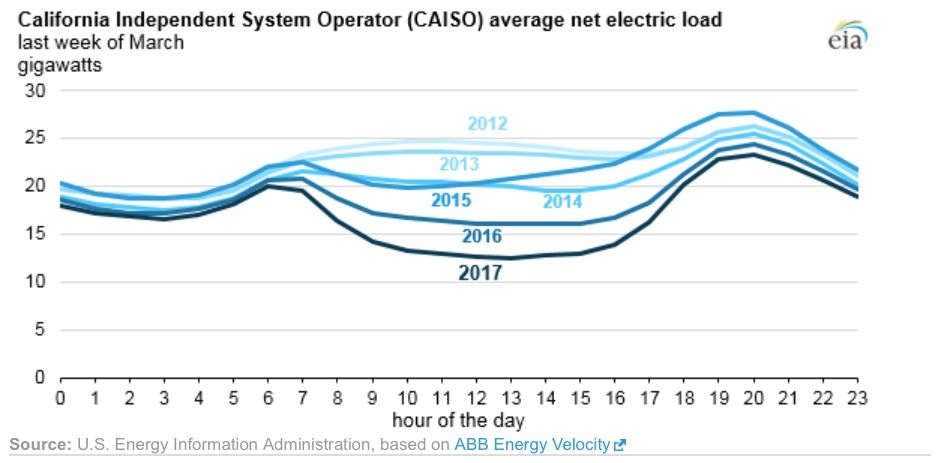
EIA dove into data for the last week of March from 2012 to 2017 to illustrate how CAISO’s net system load -- the real electricity demand and supply balance across California’s transmission system -- has shifted over that time. Taken as an average across the week, the curve for 2017 and 2016 are clearly showing the change into a duck, with clear dips in midday demand representing solar’s influence (although they’re not as stark as those revealed in energy pricing data).
But this gentle curve is creating new challenges for the grid operator, as revealed in the chart of changes in net load during the day’s four ramping periods, measured in gigawatts.
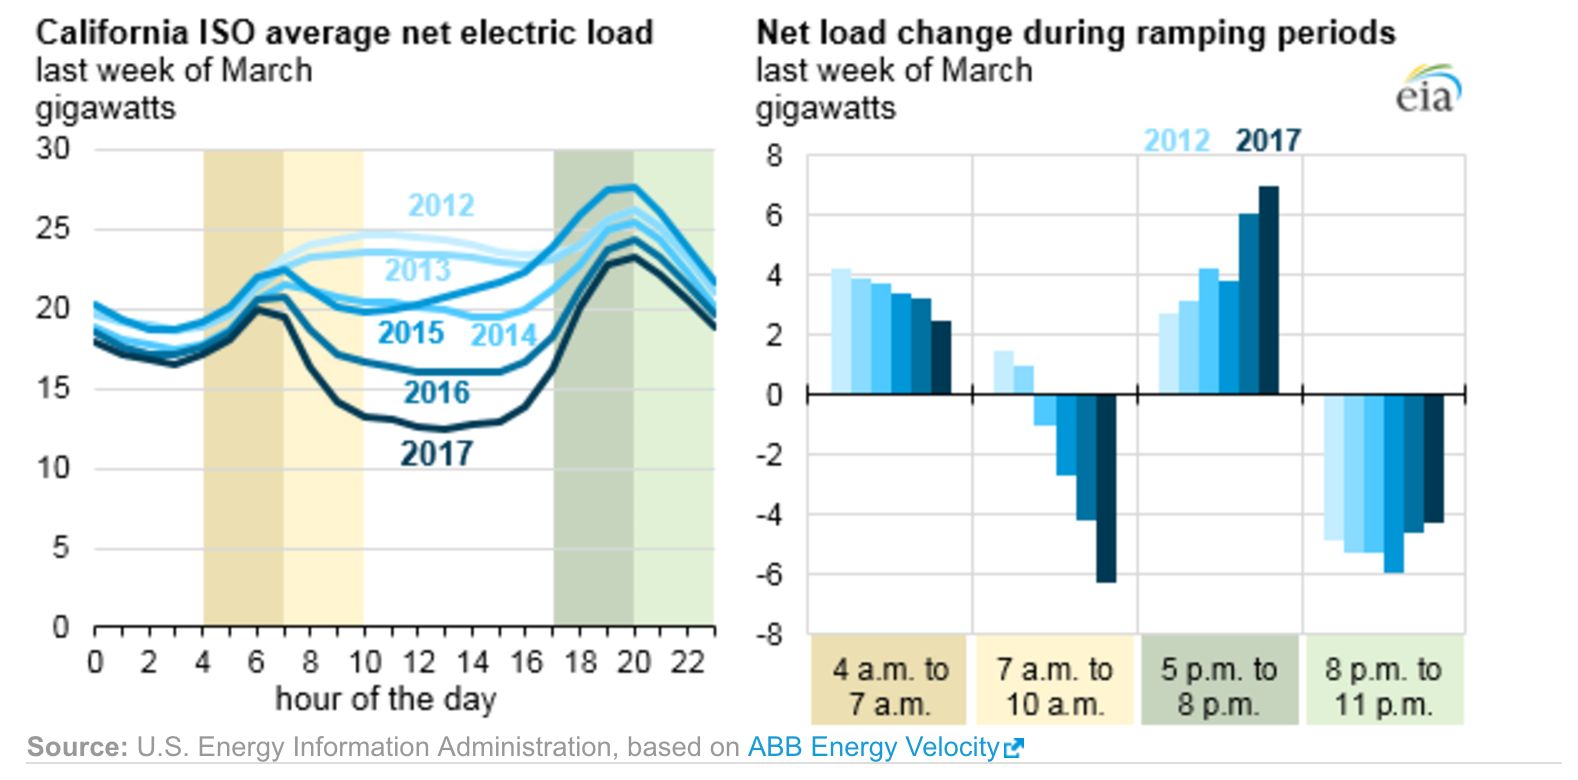
At least during the week depicted, CAISO’s needs for ramping resources grew significantly compared to years past, both to ramp down after the morning peak, and ramp up during the evening peak. That’s the metric driving higher hourly prices in the morning and evening hours, which “reflect a premium for a particular characteristic that not all generators can deliver: the ability to increase output on command.”


 41
41
 15
15
 9
9