Connecticut’s commercial solar market continues to see steady growth since the market first began to take off in 2013. GTM Research’s latest U.S. Solar Market Insight report forecasts Connecticut to cement its place as the fifth-largest commercial PV market in 2016, with 25 percent growth over 2015 expected.
Given the growing number of solar bids being selected through the state’s annual REC procurement process, commercial development is expected to continue growing in the near term. However, the degree of buildout that actually occurs will depend on whether developers can follow through on the aggressive bidding they’ve submitted into the program.
FIGURE 1: Connecticut Non-Residential PV Installations, 2010-2016E
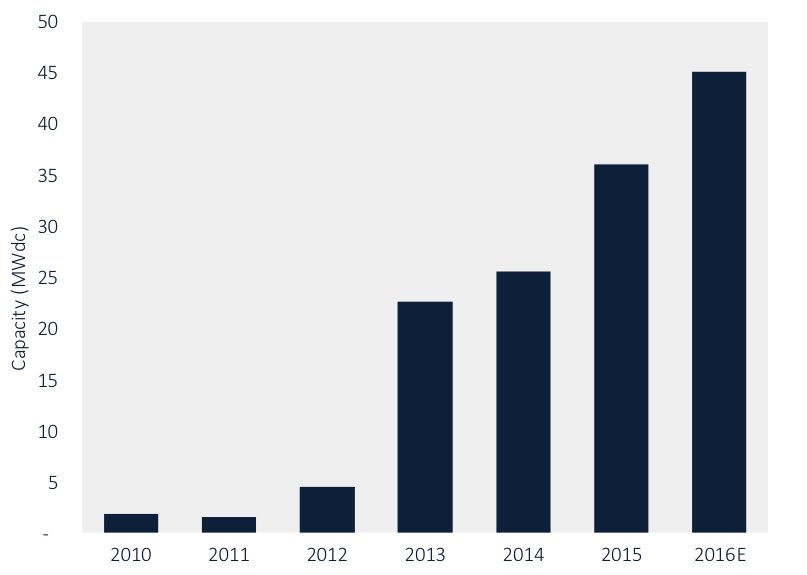
Source: Q4 2016 U.S. Solar Market Insight
To date, Connecticut’s commercial PV market has primarily been supported through its medium- and large-scale ZREC (Zero-Emission Renewable Energy Credit) programs, which are only open to systems 100-250 kilowatts and 250 kilowatts-1 megawatt in size, respectively. But Connecticut also has an LREC (Low-Emission Renewable Energy Credit) program, which expands funding eligibility to low-emission technologies such as fuel cells while also increasing the system size limit to up to 2 megawatts.
Larger-scale distributed PV is accounting for a greater share of Connecticut commercial development
Though solar has been the dominant technology in the medium-scale and large ZREC programs, solar developers weren’t even submitting bids into the LREC program until the 2015 cycle -- presumably due to the cost-competitiveness of low-emission generators, which are eligible for the program. But beginning in 2015, and confirmed with the latest solicitation data, a trend of larger-scale LREC systems making up a larger portion of the overall commercial solar pipeline has been emerging.
FIGURE 2: Selected Solar Bid Capacity (Megawatts DC) by Program -- Year 3 (2015) & Year 4 (2016)
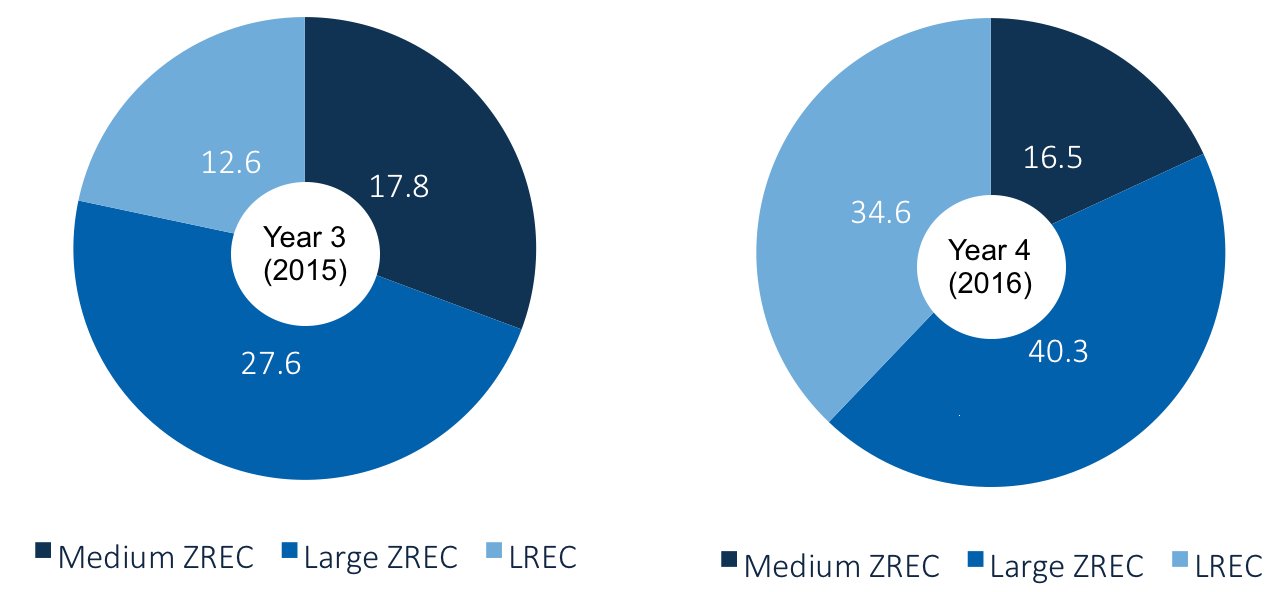
Source: Eversource ZREC/LREC RFP Results
In addition to the LREC program accounting for a larger share of solar procurement, solar is also making up a greater proportion of the winning bids selected for the LREC program, with nearly all 2016 bids awarded to large-scale solar.
FIGURE 3: LREC Selected Bids (Megawatts DC) -- Year 3 (2015) & Year 4 (2016)
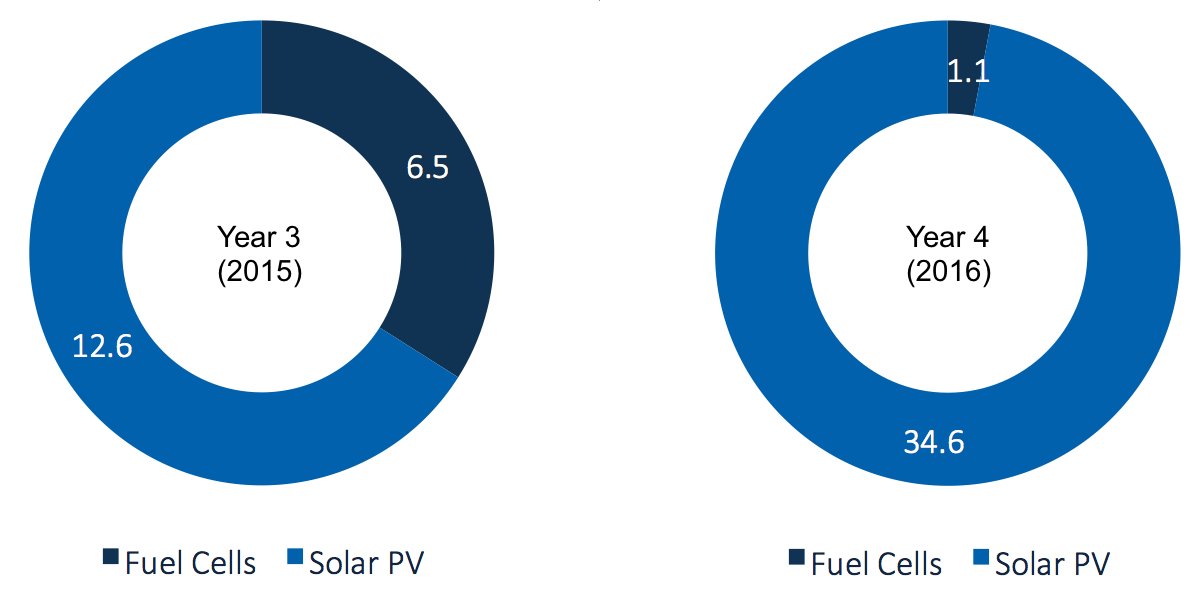
Source: Eversource ZREC/LREC RFP Results
The state’s investor-owned utilities and solicitation data both suggest that cost is the major driver of the selection rationale in the LREC RFP process. For instance, while the average bid price for selected fuel-cell projects was clearly lower -- with average fuel cell projects bidding in at $48.50/REC vs. $55.08/REC for solar projects -- average submitted REC prices (i.e., bids neither selected nor disqualified) were nearly equal. This suggests a certain degree of cost parity between the two technologies when one considers a larger sample size of bid prices. Indeed, selected bids for PV ranged from $40-$75/REC, with all but two LREC projects ultimately being awarded to solar.
The ZREC/LREC pipeline is large and mostly solar -- but will it get built out?
Despite the size of the ZREC/LREC pipeline, it’s unclear what portion of these projects will ultimately be built out. For starters, historical project completion rates over the past few solicitation years suggest a sizable amount of pipeline attrition. Only around half of all REC projects procured in January 2014 have been completed, while less than 20 percent of the ~20 megawatts of LREC projects procured and finalized in January 2015 have been completed.
That said, given the typical 12-24 month commercial development cycle, project completion rates from the 2014 solicitation year provide a more realistic range for the levels of project attrition to be expected from more recent RFPs.
FIGURE 4: Commercial Project Completion by Solicitation Year and Program Type, 2014-2016
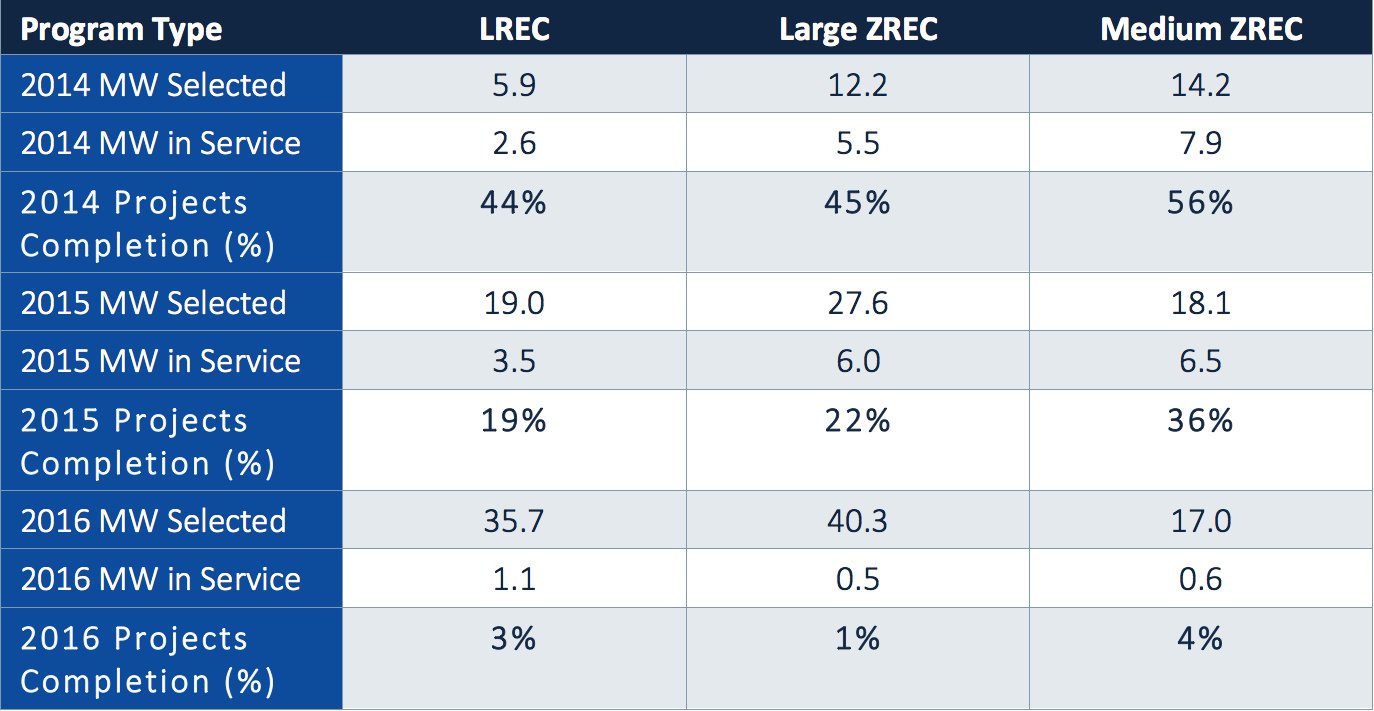
Source: Eversource ZREC/LREC RFP Results
The way forward
While it’s encouraging that solar PV appears to be more cost-competitive against other generation sources, accounting for a growing share of Connecticut’s REC procurement, project attrition and historical buildout rates for prior solicitation cycles suggest that developers may be bidding in projects at unrealistic prices.
Indeed, a look at average bid prices across program types and years suggests that average selected bids in the LREC and large ZREC program have come down by nearly $5.00/REC from the 2015 solicitation cycle, despite the average selected medium ZREC bid increasing over the same time. The industry has certainly seen a decrease in module and inverter prices that have contributed to a decrease in all-in engineering, procurement and construction (EPC) costs.
However, the combination of aggressive price declines and the limited project buildout from prior solicitation cycles calls into question whether these prices are truly executable or if developers are bidding aggressive prices to get their projects selected despite unviable price points.
FIGURE 5: Average PV Bid Prices ($/REC) by Program Type, 2015-2016
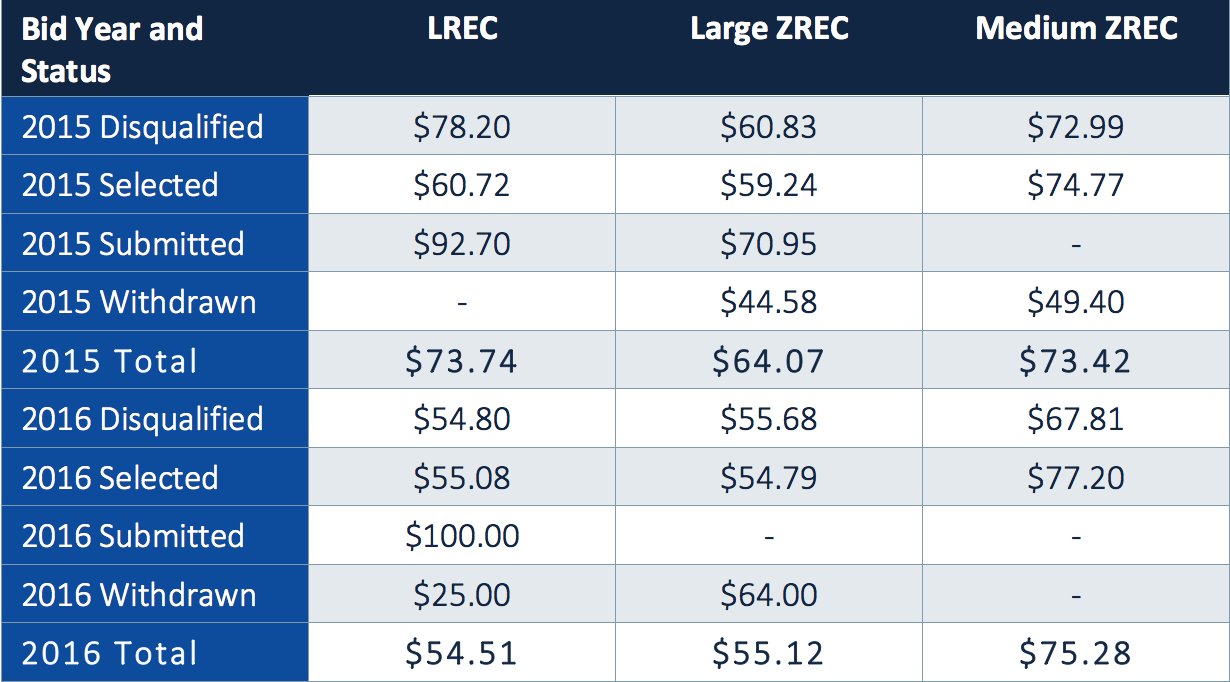
Source: Eversource ZREC/LREC RFP Results
GTM Research forecasts 59 megawatts DC of non-residential PV to come on-line in 2017 as the 2015 and 2016 procurement pipelines begin to more fully materialize. As a growing portion of the commercial pipeline is made up of LREC and large ZREC projects, our forecast assumes that this same project pipeline will see less attrition as experienced developers are more easily able to secure financing and execute on development.
Additionally, we expect 2017 to witness the continuation of a trend in municipal project build, which has been partly enabled by the state’s virtual net metering (V-NEM) program. Though funding is limited (with V-NEM credits capped at $4 million/year for municipalities and the V-NEM bill crediting structure limiting savings after year 1), there’s upside potential for virtual NEM if the state legislature can extend funding. Moreover, for projects that may have been bid at overly competitively prices, V-NEM credits may provide a viable revenue stream to help project economics pencil out.
That said, our near-term forecast is not without downside risk. If projects reach historical completion rates of the preceding RFP year -- that is, if 55 percent to 65 percent of 2015 projects and 20 percent to 35 percent of 2016 projects are completed by 2017 -- then there could be a risk of a seeing a 10+ megawatt shortfall in 2017. Conversely, projects selected in 2016 will need to see project completion rates in the 40 percent to 50 percent range in 2017 to hit our current forecast.
* * *
This report is part of GTM Research's U.S. Distributed Solar service. Get access to all of GTM Research's residential and commercial solar reports and data. Email [email protected] for a demo.