This is the second piece in a series of articles from GTM Research's just-published report assessing the global module supplier landscape. To read part one in the series, click here.
Module Supplier Taxonomy
To make sense of the existing landscape of module manufacturers, we categorize firms using the following criteria:
- Location of company headquarters
- Corporate presence (pure-play solar firms vs. diversified firms)
- Other categories (sub-region, bankability tier, technology, etc.)
The figure below illustrates the taxonomy as applied to firms based in China (click to magnify).

The figure below shows year-end module capacity by producer type in 2012. Chinese pure-play suppliers make up a full 60 percent of the total, with diversified Chinese firms accounting for another 10 percent. The other 30 percent is roughly evenly shared between companies headquartered in Japan (8 percent), Rest of Asia (7 percent), Europe (9 percent), and the U.S. (6 percent).
Competitive Positioning Metrics
We list six key metrics that define module supplier competitive positioning:
- Efficiency-adjusted manufacturing cost structure
- Near-term liquidity
- Future availability of capital
- Technology differentiation
- Brand/bankability
- Channel penetration
Competitive Positioning Assessment: Methodology
Our approach to high-level competitive positioning analysis is very simple: we assess the existing landscape of module suppliers by awarding them points based on a five-point scale. These scores can roughly be interpreted as follows:
- 5: Industry-leading status, best-in-class
- 4: Very strong, just short of industry-leading status
- 3: Competitive
- 2: Weakly positioned
- 1: Worse than most firms
We admit this method is at best quasi-quantitative. But at the very least it allows us to differentiate between the many firms in the space with some degree of granularity. For example, not all China-based module suppliers have similar cost structures, and it is necessary to differentiate between industry leaders such as Trina and Yingli and higher-cost firms such as Suntech Power. Moreover, it also helps us establish facts and gain insights about groups of companies on a somewhat empirical basis. Below, we examine the competitive positioning of the diversified Chinese firms in more detail.
Competitive Positioning Assessment: Diversified Chinese Firms
Diversified c-Si firms own 31 percent (6.8 gigawatts) of domestic capacity share. Most of these are privately owned -- the large state-owned enterprises have yet to make any significant mark in PV manufacturing thus far. Some diversified firms (Hanergy, ENN) have also made bets on thin film technology. The figure below shows the competitive positioning matrix applied to select major diversified Chinese solar firms (click to magnify). Below, we examine their performance on key metrics in greater detail.

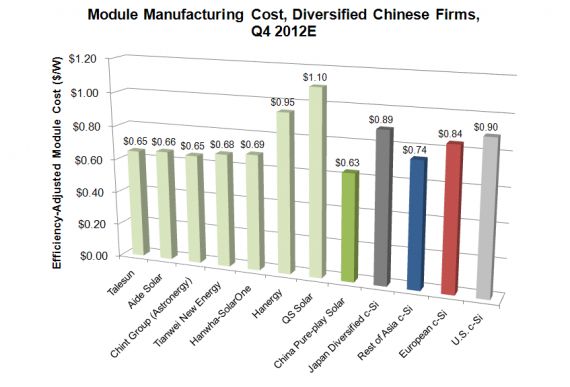
- Manufacturing Costs. While the diversified Chinese c-Si firms are comfortably below most non-Chinese firms on manufacturing costs, they generally trail the larger pure-play firms on manufacturing costs by around 10 percent to 12 percent. The thin film firms (Hanergy, ENN, QS) are not currently cost-competitive on an efficiency-adjusted basis.
- Brand/Bankability and Channel Penetration. Most diversified Chinese firms are relatively new to the PV module business and so trail the Tier 1 and Tier 2 firms with regard to brand and performance/reliability-related bankability. Unlike the Japanese and Korean conglomerates, these firms are not well known globally, and most of them have not spent any real marketing dollars to raise their profile, aside from Astronergy. At the same time, their bankability on a balance-sheet basis is very strong due to their well-capitalized parents. Some of these firms (e.g., Alex Solar, Astronergy) have leveraged their parents’ networks to move into project development and EPC in the domestic market, and expect to deploy significant volumes there going forward.
- Technology/IP. Most diversified firms are relatively undifferentiated in terms of manufacturing technology and leverage innovation at the equipment and materials level for further improvement. Some notable exceptions are Astronergy, which has been an early adopter of Varian’s (now a subsidiary of Applied Materials) ion implantation technology for emitter diffusion, and BYD, which is commercializing a proprietary variant of selective emitter (NES, or narrow finger and busbar electroplated selective emitter).
- Balance Sheet and Capital Availability. Unlike their pure-play peers, the diversified firms can count on the support of their parent companies for additional funding -- but only as long as the parent remains committed to the PV business. In the current business environment, this cannot be taken for granted.
- Strengths. The key advantage that diversified Chinese firms have is access to their parents’ capital, which confers obvious advantages in terms of capacity expansion, balance sheet-related bankability, and available finance for project development. The strong position and connections held by their parents also gives them an advantage in the domestic market.
- Weaknesses. Most of the diversified firms have poor brand recognition outside of China, and trail most of the industry when it comes to time-in-market. They generally lack the several years of field data that could alleviate concerns around module performance and reliability that are a key consideration in bankability-sensitive markets such as Canada and the U.S. Thus far, they have displayed little business model flexibility outside the domestic market, and they have struggled to penetrate markets outside Germany and China.
Report author Shyam Mehta talks about solar module winners, losers, who gets acquired, and what the market looks like in 2013-2014 in this podcast. For more information on the report, click here.


 41
41
 15
15
 9
9