This is the third in a GTM Squared series on the companies, technologies, applications, and opportunities in the U.S. building energy management system market.
The analysis, from industry expert Joseph Aamidor, dives deep to quantify the BEMS vendor landscape. The series answers key questions about the market, including:
- Which vendors have significant market share? Which are growing fastest?
- How much vendor turnover has there been in the market?
- What is the current penetration of BEMS within commercial buildings?
- Which building types offer growth opportunities?
Click here to read Part 1 and here for Part 2.
Understanding and quantifying the building energy management system (BEMS) space is a difficult exercise. The market is fragmented, there are a variety of overlapping solution offerings from legacy solution providers, and there are differences in the core capabilities that particular building types require.
While imperfect, Energy Star data does provide some insight into this market. The previous articles in this series made the case for using Energy Star data as a proxy for the market and highlighted market trends that can be quantified using this data source.
Common questions from market observers, investors and entrepreneurs themselves often center around the competitive landscape. Specifically, many wonder if the market for smart building and energy management technology is starting to consolidate. There have been some recent acquisitions made by large service providers, such as Ingersoll Rand (parent company of Trane) buying Agilis, Acuity buying Lucid, and Siemens buying J2 Innovations, Enlighted and Comfy. The Energy Star vendor data can also be used to address the question of market maturity and consolidation.
Average Number of Buildings Benchmarked per Vendor and Total Number of Vendors Exchanging Data With Energy Star
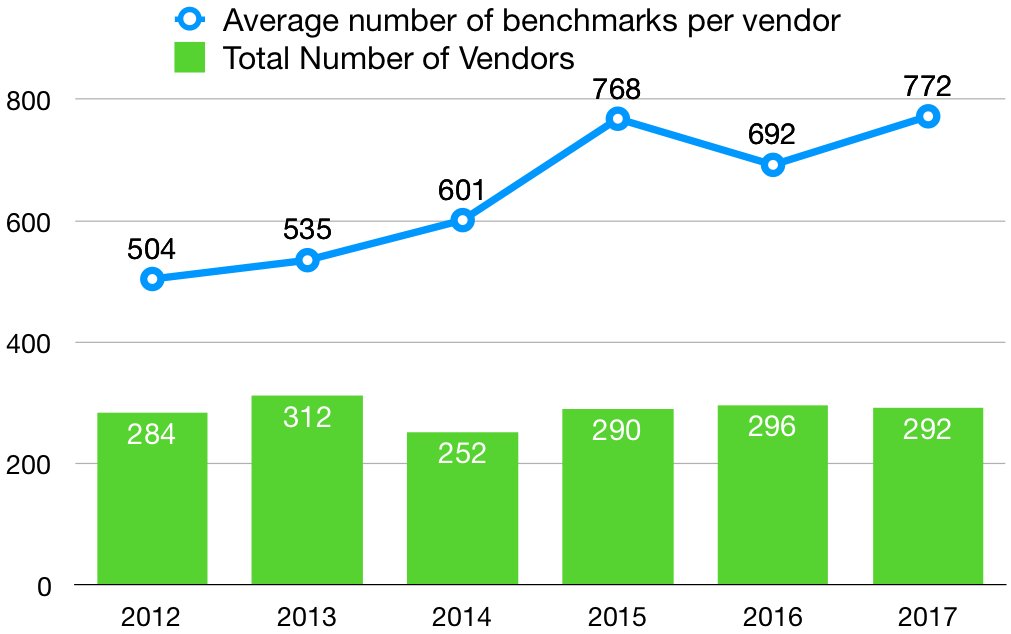
Source: Energy Star
Energy Star benchmarking is a good analogue for the market landscape because it is a mature requirement, one that is well defined and well understood by building owners and operators. Additionally, there are municipalities that require buildings to provide their score annually for benchmarking purposes. Moreover, the technical barriers to entry are not as high as they can be for more advanced capabilities, such as interval data analysis, fault detection or predictive equipment analytics.
The average number of buildings each vendor benchmarks is increasing, in line with the overall growth of Energy Star benchmarking. But the number of vendors providing this service remains very high — fluctuating between 252 and 312 (but typically hovering close to 300). While many leading benchmarking firms are showing growth, this is due in large part to more widespread adoption of the standard. Firms showing declines in the number of buildings they benchmark still provide the service, ensuring market fragmentation.
However, there are some reputable data sources that indicate the market is far less mature than what Energy Star data indicates. As reported in Deloitte’s Resources 2018 Study, the firm conducted surveys on the use of software to manage resource management programs. The survey data indicated that as of 2018, 64 percent of respondents are still using spreadsheets. The share has remained fairly stagnant for the past three years, according to Deloitte. Another 39 percent of the respondents use a custom software product developed exclusively for their own operations.
These shares seem surprisingly high, but they are focused on all resource data, not just energy consumption. One possible explanation is that many firms use a commercially available product to manage building energy consumption, but that product is still linked to an internal spreadsheet or custom software platform to centralize with other resource data.
Regardless, a variety of different types of firms provide Energy Star benchmarking, and it appears to be only a piece of each vendor’s offering. For example, large HVAC and controls firms offer this capability, as do sustainability data management software vendors and utility bill-pay providers, plus both early-stage and mature energy management software providers.
Moreover, a large number of firms on the Energy Star list benchmark 25 or fewer buildings. Each year, at least 98 firms, and up to 144 providers, have benchmarked 25 or fewer buildings. In many cases, these firms appear to be local mechanical contractors or other engineering firms. Mechanical contractors in particular are typically very small; some estimates indicate that there are 80,000 firms in the U.S. and most earn less than $1 million in revenue a year. The inherent fragmentation in building services is evident in this list of Energy Star vendors, as well.
Top 25 Vendors as Share of Total Energy Star Benchmarks, 2012 vs. 2017
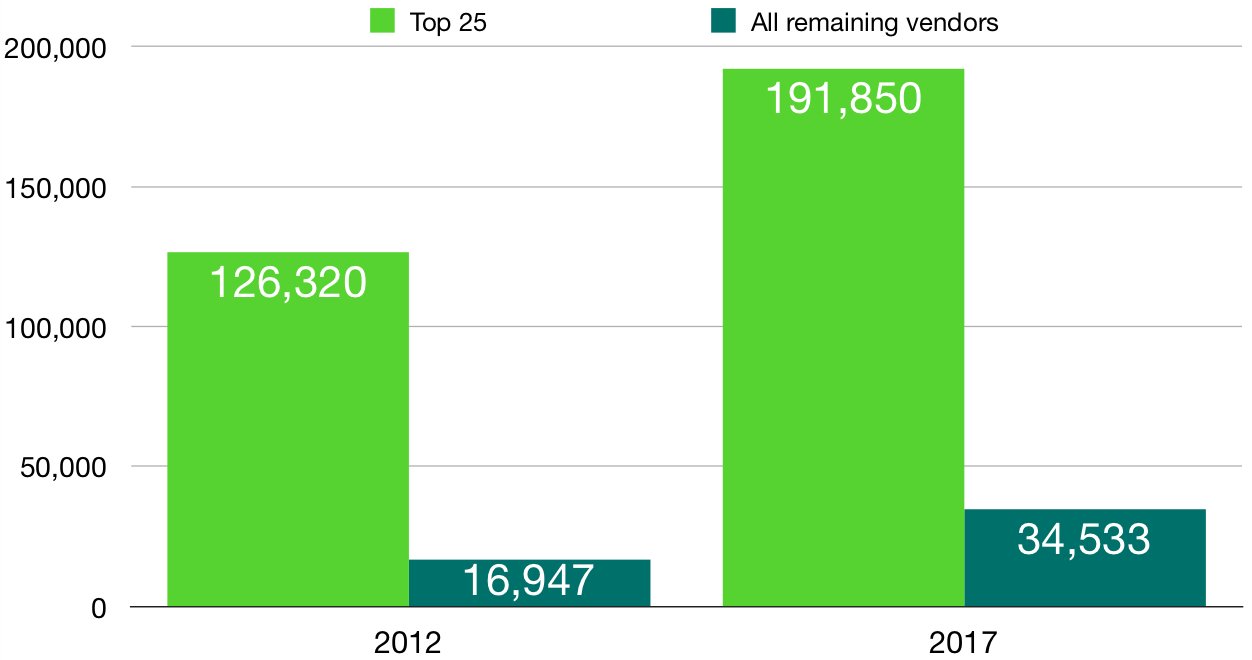
Source: Energy Star
Another way to look at market consolidation: The top 25 vendors on the Energy Star list accounted for 88 percent of all benchmarks in 2012, which declined slightly to 85 percent in 2017. Looking at the top 10 vendors, in 2012, they made up 78 percent of all buildings benchmarked, which again declined slightly to 70 percent in 2017. This indicates that there is a very long tail of vendors: Nearly 90 percent of buildings are benchmarked by fewer than 10 percent of the vendors. But, this has been the case since 2012. And, while the number of firms providing Energy Star benchmarks is fairly stable at about 300 entities, the smaller players are growing in total number of buildings. This also indicates that the market is not consolidating.
Beyond building energy management, what can we infer about the market opportunity for smart building and BEMS solutions in the future? This emerging market is expected to grow significantly in the coming years, based on new internet-connected systems that will enable data-driven operational approaches and business models.
Looking at Energy Star and Commercial Building Energy Consumption Survey (CBECS) data, the growth opportunity appears to be nuanced. While a significant share of buildings (by square footage) have an Energy Star score, even more square footage already has a building automation system. Both have far greater penetration in larger buildings. Given that there are only a handful of BAS makers, typically part of multibillion-dollar enterprises, the market to sell smart building solutions may flow through them — with existing sales and distribution channels, name recognition and longstanding relationships with building owners and operators.
Penetration Rates of Energy Star and Building Automation Systems
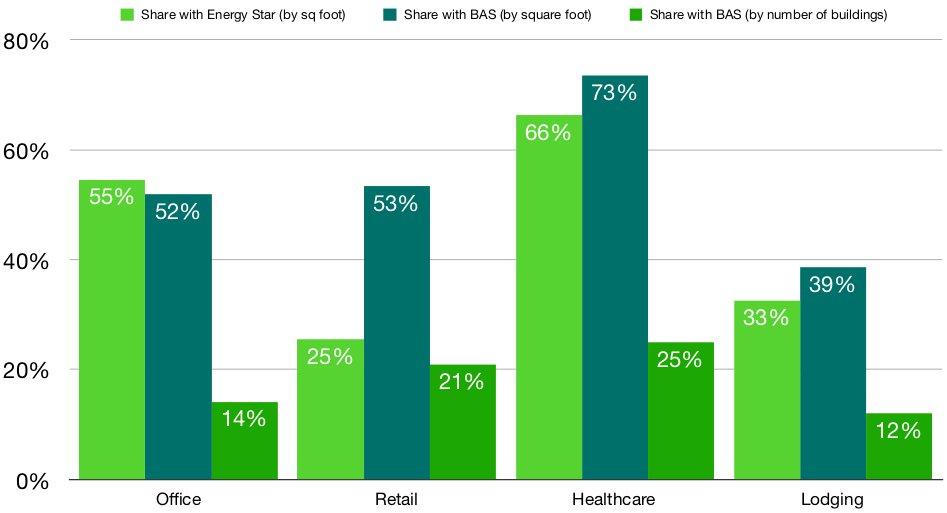
Source: Energy Star and CBECS
Alternately, the market for smart building solutions may grow in variety. There could be more capabilities that are offered by more vendors, all integrating together at some level. It appears that this has started to happen for building energy management systems. Matt Ellis, CEO of Measurabl, views the competitive landscape cooperatively: “In our case, we have a growing pie where vendors provide more overall service to the same building by specializing and due to growing total consumption of sustainability-related services by a building.“
Vendors that offer Energy Star and other building energy management capabilities are upbeat on the market opportunity in the future. However, the growth in the market appears to be dependent on addressing the small buildings, or identifying offerings that can be provided in tandem with existing vendor products.
A previous article in this series highlighted the long tail of commercial buildings. Specifically, 4 million of the 5.6 million commercial buildings are under 10,000 square feet in size. These smaller buildings — with the exception of retail and restaurant sites of large companies — have been overlooked by large and small vendors alike when it comes to building and energy analysis and data-driven software solutions. This is primarily because it is hard to market and sell to these firms, and each individual building represents a very small opportunity relative to the total commercial building landscape. But for both energy management and building automation solutions, these smaller buildings may be one of the best places for vendors to target.
Additionally, lodging buildings do not have as much penetration in both Energy Star benchmarks and BAS deployments. That said, many smart home solutions, focused on voice control, security (cameras and locks) and lighting, may all be differentiators that hotels can use to attract guests. In a larger hotel, the individual smart home equipment will require a supervisory control and monitoring platform to enable building operators to manage them at scale. This supervisory layer is not always provided by the smart home OEMs. Between the clear value proposition for smart hotel rooms and the below-average penetration of building technology, this segment may present a strong opportunity for vendors.
Retail buildings also have below-average adoption of Energy Star, with only about 25 percent of the total square footage benchmarked. Other building segments are somewhat fragmented in ownership: Large office buildings are owned by a large number of firms (both commercial real estate firms and most businesses in the Fortune 500). But of the top 100 retailers ranked by the National Retail Federation (which include 85 retailers and 15 restaurant chains), the larger firms do hold a significant share of the building stock. Just the 85 largest non-restaurant retailers account for about 25 percent of all mercantile and food sales buildings in CBECS. It’s likely that the penetration is even greater on a square footage basis, though this list does not provide building size.
Some of the largest retailers are strong supporters of Energy Star, which indicates strong support for energy efficiency. Target, with over 1,800 stores, has received Energy Star certification for 1,400 of them. Kroger, with nearly 4,000 stores, has benchmarked over 1,900 and certified nearly 800. Despite over 50 percent of retail square footage having a building automation system, this segment may be among the most attractive for both energy management and smart building vendors. A significant share of the market can be addressed by focusing on a relatively small number of owners/operators. And, to the extent that corporations with robust energy management programs will be early adopters of smart building technology, there are a number of strong targets in retail.
The 15 largest restaurants on the NRF list make up 31 percent of the “food service” CBECS category of buildings. Restaurants have not been included in this analysis thus far, simply because Energy Star does not break out counts for this building type (although many restaurant buildings do have Energy Star scores). In addition to strong penetration among a limited number of large companies, only 14 percent of the square footage and 10 percent of these buildings have a building automation system. This is a lower rate of penetration compared to other building types, which may indicate a solid growth opportunity in the future. And because these sites typically do not have full-time facility staff on-site, a data-driven smart building offering that automatically identifies anomalies and notifies remote staff may differentiate itself in the market.
The market for building energy management and smart building systems is fragmented and nebulous. Using Energy Star as a proxy for energy management market penetration and comparing the data to CBECS, some trends emerge. The best opportunities seem to be within specific building types, though a number of vendors — especially smaller startups — are showing significant growth by growing share across a range of energy and sustainability services. There is no sign of market consolidation, but given the spectrum of building types and large number of established vendors in specific market segments, perhaps the industry is destined to remain fragmented.