
In June, we showed that regional installers are growing at a quicker pace than their large national competitors. A deep dive into the three major investor-owned utility (IOU) territories of California shows that the success of these regional and local installers might be the key to continued growth in this mature market.
As net metering caps loomed over all three IOU territories in the first half of 2016, only solar in SDG&E territory actually experienced significant demand and hit the cap. This occurred as solar in the utility territory grew 4 percent over last quarter.
In contrast, PG&E and SCE are not expected to hit their net metering caps until the next six to 12 months, and both saw decreases in installation capacity from Q1 to Q2 2016.
According to analysis of utility-level data from GTM Research’s Q3 2016 U.S. PV Leaderboard, customers of SDG&E are much less reliant on national installers than their peers in the other territories.
FIGURE 1: Combined Market Share of National Installers by IOU Territory
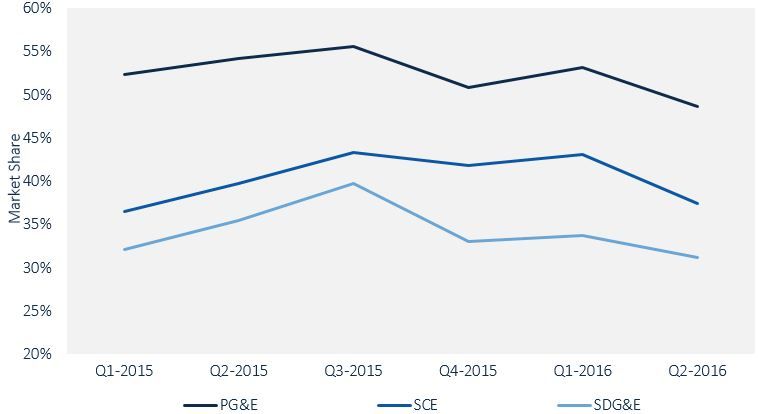
Source: GTM Research U.S. PV Leaderboard
The difference between positive growth in San Diego and negative growth in the two other IOU territories comes down to differences in just the top three California installers, namely, SolarCity, Sunrun and Vivint Solar.
FIGURE: Quarterly Growth With and Without SolarCity, Sunrun and Vivint Solar by IOU Territory (Q2 2016 vs. Q1 2016)
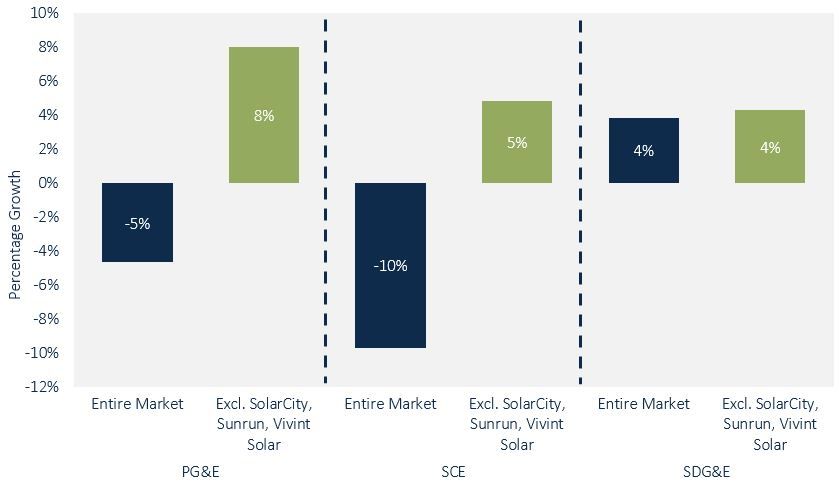
Source: GTM Research U.S. PV Leaderboard
As illustrated above, the local and regional installers in the PG&E and SCE territories have been affected less by the broader slowdown in the California solar market than have their national competitors.
Installation capacity in PG&E and SCE fell by 5 percent and 10 percent, respectively, from Q1 2016 to Q2 2016. By removing just SolarCity's installations from each of these service territories, the story flips and a pattern of growth emerges.
By additionally removing Sunrun and Vivint Solar from the equation, these territories show an even greater increase in installation capacity, at 8 percent for PG&E and 5 percent for SCE. In SDG&E, where the national installers contribute less than a third of new installation capacity, national and local installers are growing at approximately the same pace of 4 percent.
What does this mean for prospects for growth into the future? All over California, despite small dips in the overall markets, these regional and local installers have been growing. And if the large installers continue to show slowed growth, it will be the smaller installers who must fill the gap.
***
GTM Research's U.S. PV Leaderboard tracks quarterly market shares for installers, inverter suppliers and module manufacturers. For more information, download the brochure here or contact [email protected] for a demo.


 41
41
 15
15
 9
9