
Energy storage is shaping up to be the topic du jour at this year's Intersolar North America. The subject even has its own sub-conference at next week’s event in San Francisco.
While new behind-the-meter storage installed in the U.S. was just 0.1 percent of the new solar PV installed in 2014 (6.2 megawatts compared to 6,200 megawatts, according to GTM Research), exhibitors with behind-the-meter storage solutions represent nearly 5 percent of all companies at the tradeshow. High expectations for the growth of this nascent market, particularly in demand-charge management, prompts the question: Are projects viable outside of California, Hawaii and New York? The short answer is yes, but in limited numbers. However, if battery prices fall as expected, those totals will grow quickly.
Unlike solar PV, there is no standard avoided-cost benchmark for energy storage. Every project’s economic viability is a function of the host’s load profile, utility rate, and energy storage system size. At Geli, we generate a “facility fingerprint,” which uses sub-hourly demand to determine the value of demand-charge management. Having performed over 1,000 analytic designs, we used this process to identify utility rates that provide a five-year payback for an “average” demand charge management project. To plot the trajectory of market growth, we compared the fingerprint of a commercial facility against OpenEI’s publicly curated database of 3,000-plus commercial and industrial tariffs that include a demand component.
The project used for this analysis is a commercial facility in California with a 500-kilowatt monthly peak load and 18,000 kilowatt-hours of consumption. The site is located in PG&E territory and qualifies for California’s Self-Generation Incentive Program (SGIP) program. Analysis revealed a 120-kilowatt/240-kilowatt-hour system will provide real monthly demand savings of 23 percent with a projected payback period of 4.2 years (all assumptions used in this analysis provided below). Without SGIP, payback stretches to 7.4 years, which is greater than the five-year payback threshold we used for this analysis. However, using our project design tool, we were able to determine that even without incentives, this project is viable in nine other utility territories in seven different states.
Figure 1: Sample Project Overview
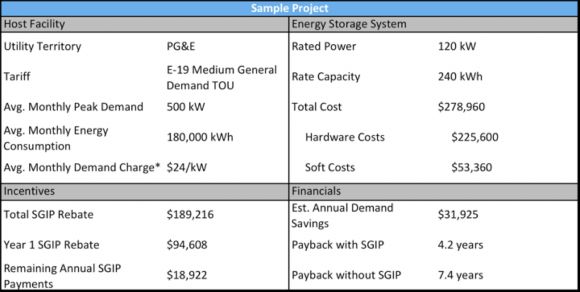
*Combination of max, part peak, and max peak demand charges averaged over 12 months
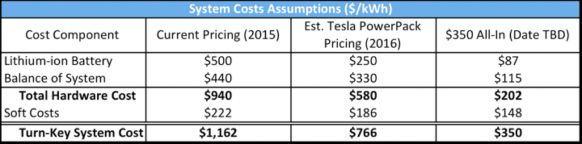
Without incentives and using an all-in price estimate of $1,162 per kilowatt-hour (including battery, balance-of-system, soft costs, etc.), the project requires a monthly demand charge of $38 per kilowatt to meet our five-year payback hurdle. Adding solar PV to take advantage of the 30 percent federal Investment Tax Credit opens up an additional 105 rates from 33 utilities in 8 more states with a minimum demand charge of $24 per kilowatt. Changing power-to-energy ratios (we use a two-hour system in this example, as that maximizes SGIP) can improve project economics significantly.
In May, Tesla announced its $250 per kilowatt-hour C&I Powerpack. This price -- which is for the battery only and includes no power converter, BOS, operating software, or soft costs -- is half our baseline $500 per kilowatt-hour figure. If $250 per kilowatt-hour were the market price for lithium-ion batteries (and non-battery costs scaled accordingly), the number of tariffs that are viable increases nearly sixfold. With an estimated installed cost of $766 per kilowatt-hour, the Tesla Powerpack requires an average minimum demand charge of $26 per kilowatt. We anticipate systems being available at this price point sometime in 2016.
Figure 2: System Cost Analysis Assumptions
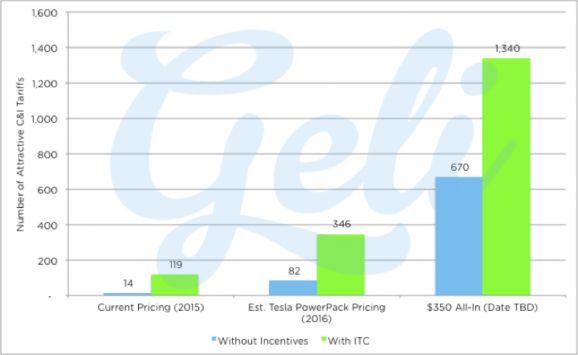
But what if a system cost $350 per kilowatt-hour all-in, the price that was widely reported on after Tesla’s announcement? This is when the market really starts to open up: 670 tariffs from 246 utilities in 38 different states with a minimum required demand charge of $13 per kilowatt. If these projects were able to claim the ITC as well, the numbers nearly double to 1,340 tariffs from 455 utilities in 46 states.
Figure 3: Number of Attractive Tariffs for Two-Hour DCM System
One thing that this exercise did not reveal was exactly how many customers are on each of the attractive tariffs. What it does say is that savvy developers with good analytical tools should be able to source projects outside of incentive-driven markets. The key to seizing as many of these opportunities as possible is the ability not only to identify opportunities efficiently, but also to quickly design systems that are able to meet the requirements of each market as well as the end customer.
***
Andrew Krulewitz is director of marketing and product at Geli. Sita Saueregger and Jacques de Chalendar, Geli graduate student interns, contributed to this artcle.


 41
41
 15
15
 9
9