
The early months of 2017 brought a departure from normal global horizontal irradiance, the key variable for PV plant production.
GTM has partnered with Vaisala, a company that monitors solar performance across the U.S., to give the solar industry a better understanding of how these weather trends are driving solar performance around the country.
The most recent set of maps evaluate the first three months of 2017.
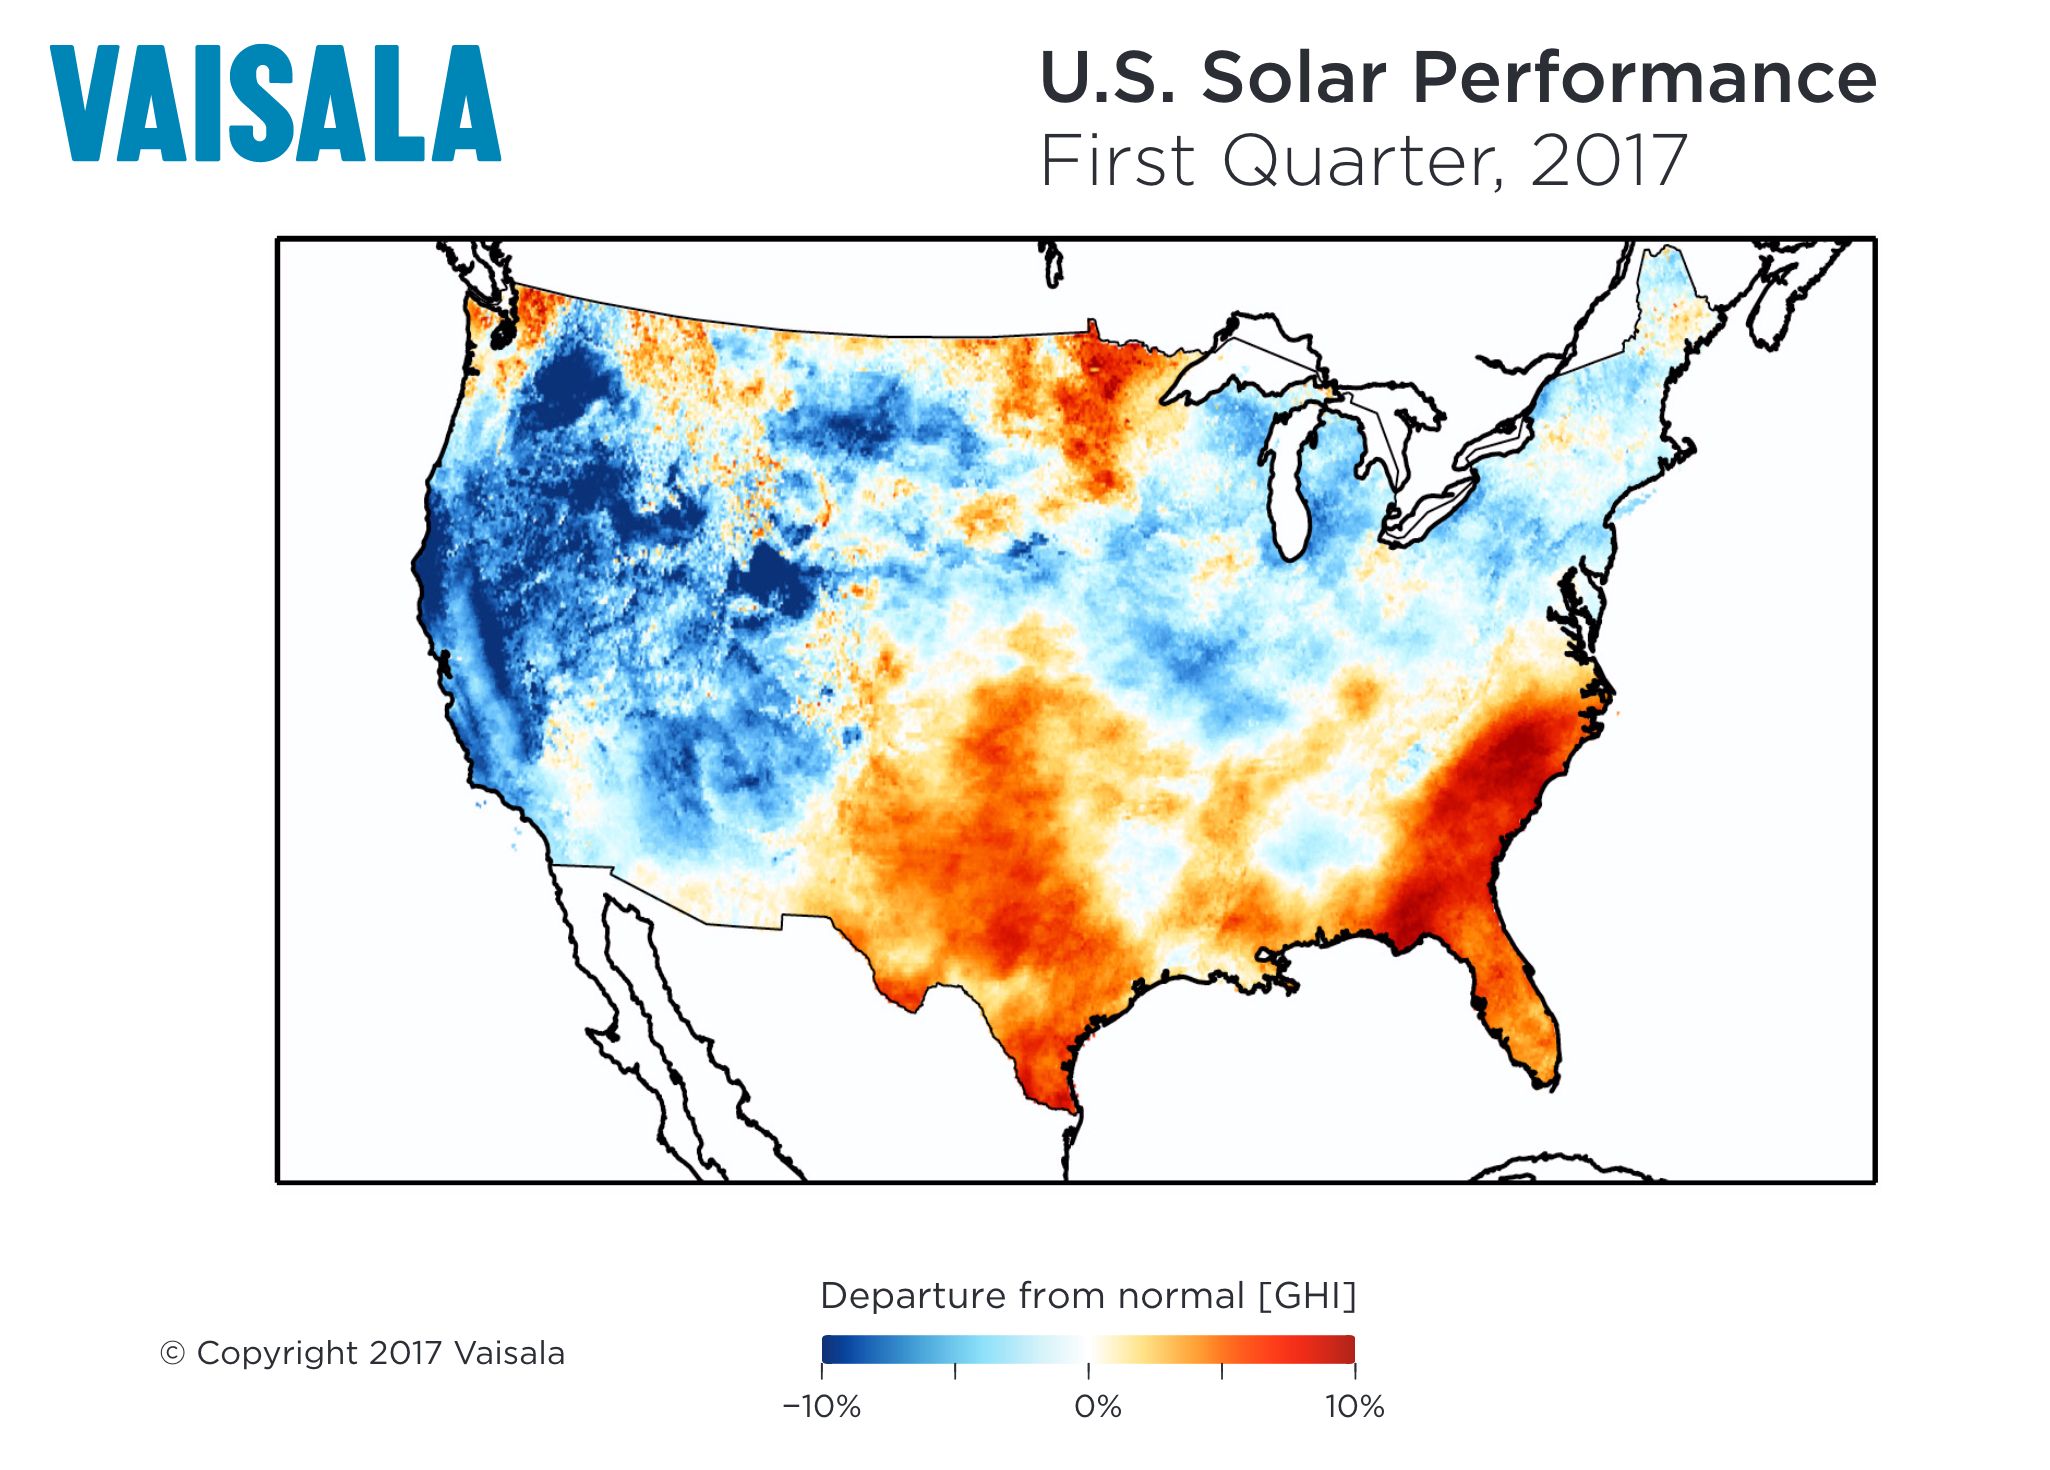
The first quarter was warm and wet for much of the contiguous U.S. As illustrated by Vaisala’s Q1 map, wet conditions prevailed in the West, Southwest, and south-central Midwest regions, while warm and dry conditions were experienced in the Southeast. The regional pattern of above- and below-normal solar conditions across the country is also consistent with extreme temperature and precipitation recorded by National Oceanic and Atmospheric Administration (NOAA) for the first quarter of 2017.
For example, in the Southeast, this year’s February through March period was the fifth driest in almost five decades. In contrast, in the West, January through March was the fifth wettest in almost two decades. Along with these regional precipitation anomalies, extreme average temperatures were also reported.
In the South, as noted by NOAA, this year’s January through March period was the warmest three-month period to date. The Southeast, specifically, experienced the third warmest January-March period since 2012, and 2012 set the record.
Warmer-than-normal wintertime conditions have a direct effect on the energy industry at large because they reduce energy demand related to heating. To place these recent conditions in context, the contiguous U.S. temperature-related energy demand during this year’s winter period was 85 percent below average. That is the third lowest in the 123-year period of record, according to data from NOAA’s Residential Energy Demand Temperature Index (REDTI).
In terms of the effect on solar energy, almost 30 percent of U.S. solar energy capacity is concentrated in California, Arizona and Nevada. All of these states experienced large, negative global horizontal irradiance (GHI) anomalies during the first quarter, with some areas exceeding 10 percent below normal. This heavy rain and cloud cover negatively impacted many solar operators within the region.
Interestingly, despite the low solar conditions in the Southwest, the anomalously high precipitation amounts in the West and Southwest, in combination with lower-than-normal energy demand, resulted in an oversupply of hydroelectricity. Consequently, energy generation from both wind and solar was strongly curtailed within the CAISO region during the first quarter. Even with this heavy curtailment, the CAISO real-time electricity price went negative on two occasions in March.
Looking at Vaisala’s Solar Performance Map of the first quarter, the observed regional pattern of negative anomalies and positive anomalies, speaks to the importance of strategic portfolio design, especially in terms of diversifying by technology and geographic distribution of assets.
Source: Vaisala
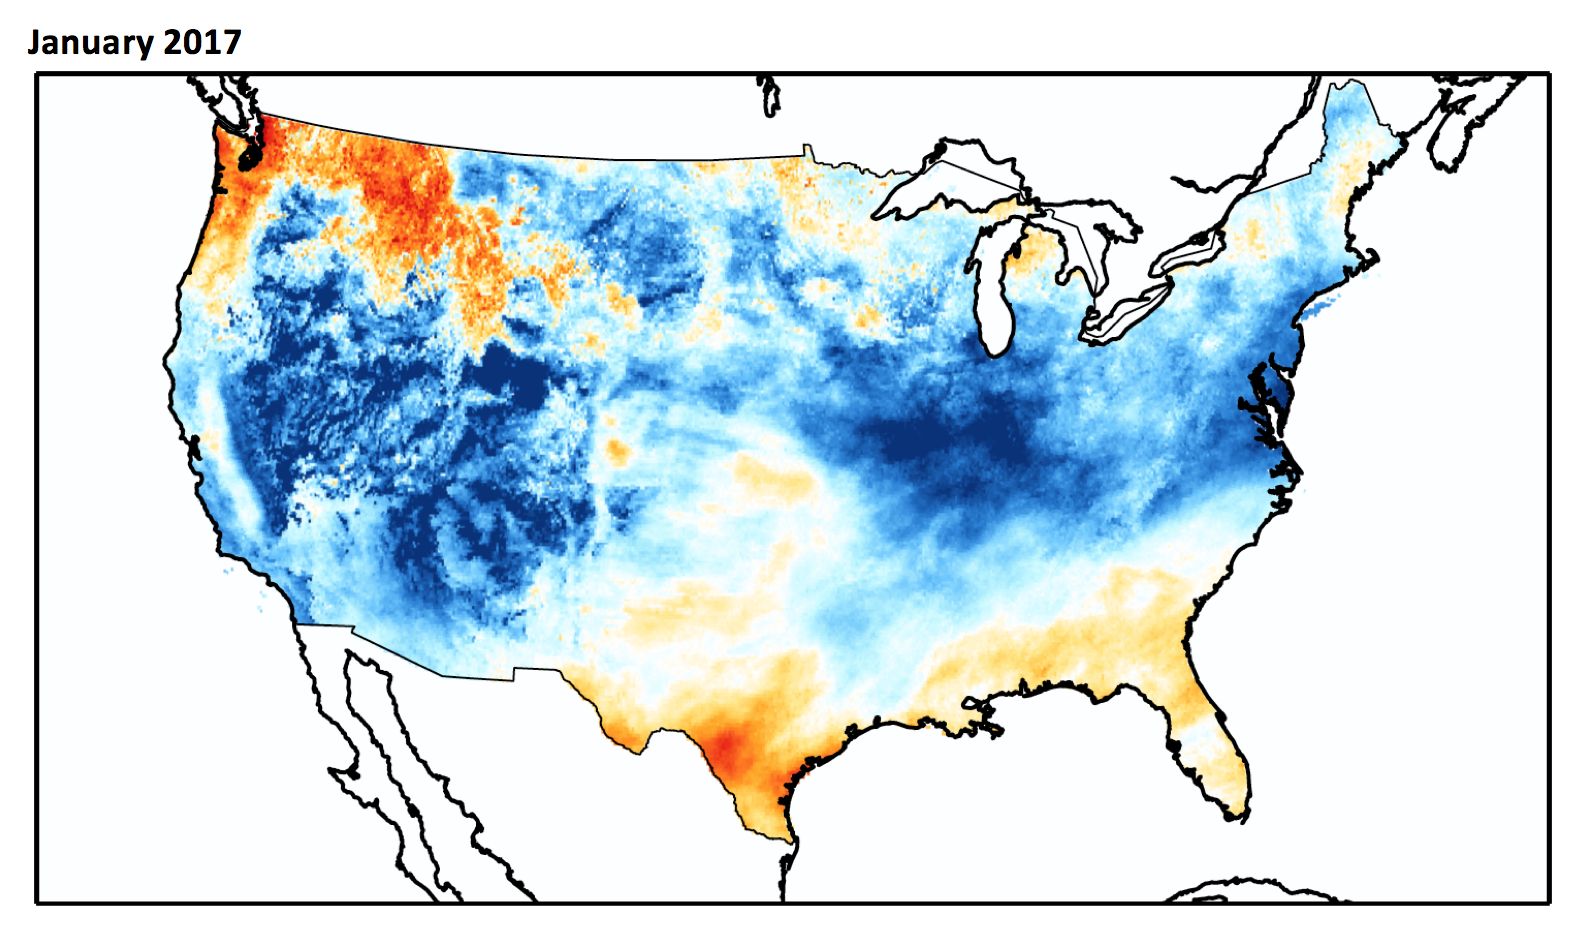
January’s weather was dominated by cold fronts and above-average precipitation over most of the contiguous U.S., thus creating below-average solar conditions in many areas. For example, the Southwest ranked eighth, and the West ranked fourth, in terms of the most extreme 1-day precipitation events for the month of January based on over 100 years of data. However, the above-normal precipitation brought some much-needed relief to many drought-stricken areas and also helped reduce the number of wildfires that occurred in the Southern Plains region in January.
The month also saw a record number of tornadoes, with 134 recorded by NOAA’s Storm Prediction Center -- nearly four times the 1991-2010 average of 35. The majority of these events were confined to a swath of Gulf Coast states from southeast Texas to Georgia, brought on by moist air from the Gulf of Mexico feeding into the prevailing weather systems in this region.
As a result of related thunderstorms, tornadoes typically produce heavy cloud cover, which reduces surface solar irradiance conditions in the area surrounding the storm. Similar to other forms of severe weather, tornadoes include high wind gusts and often hailstorms, which are important considerations for insurance structuring and claims.
Source: Vaisala
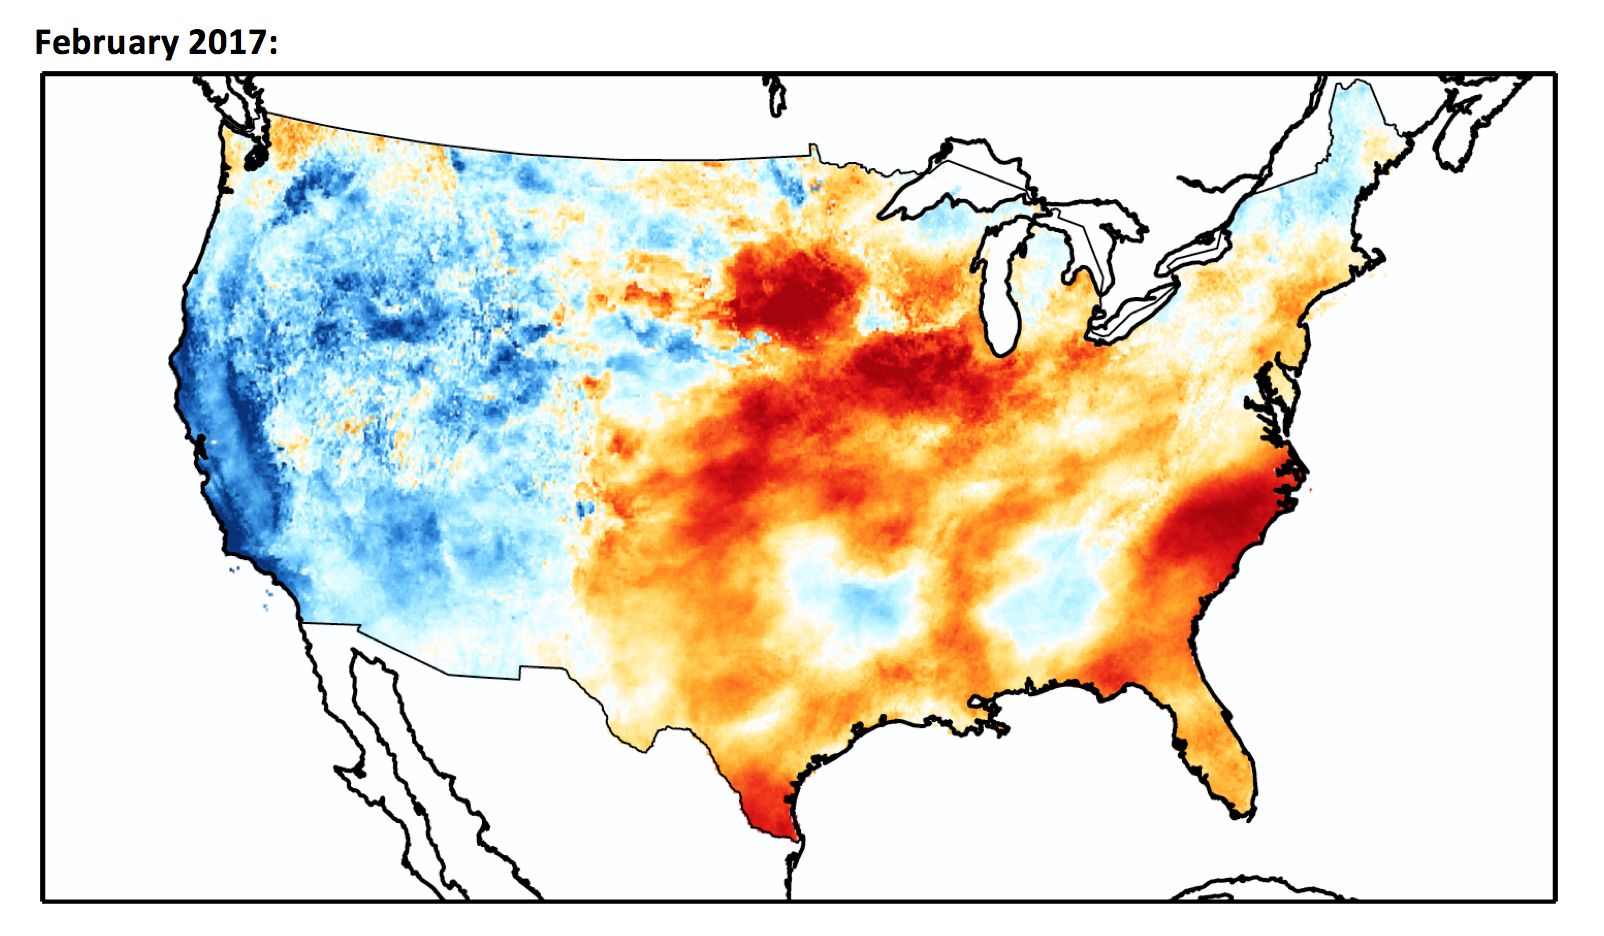
In February, negative GHI anomalies were primarily confined to the western half of the country, and positive GHI anomalies were experienced in much of the east. Continuing record-warm temperatures help explain the above-average solar conditions, with states from Texas to New York experiencing the warmest February relative to 1895-2017 data. Meanwhile, vigorous weather systems originating in the Pacific once again resulted in above-normal precipitation in the western U.S.
In contrast, large wildfires continued to burn in the Southern Plains, especially Oklahoma and Arkansas, with fires developing in Florida and eastern Kentucky as the month progressed. NOAA’s weekly precipitation anomaly maps for the first three weeks of February indicate these areas experienced below-normal levels of precipitation, by 30 percent or more, contributing to the spread and persistence of fires. Haze from wildfires, like all aerosols, reduces surface solar irradiance conditions, which is accounted for in our data set and resulting maps.
Cold fronts and low pressure systems also tracked across the East, producing outbreaks of severe weather during February. Similar to January, February saw four times the 1991-2010 average number of tornadoes, with 115 recorded. However, these were not just in the Gulf States, but also reported in the Southern Plains, the Southeast and the Midwest.
Source: Vaisala
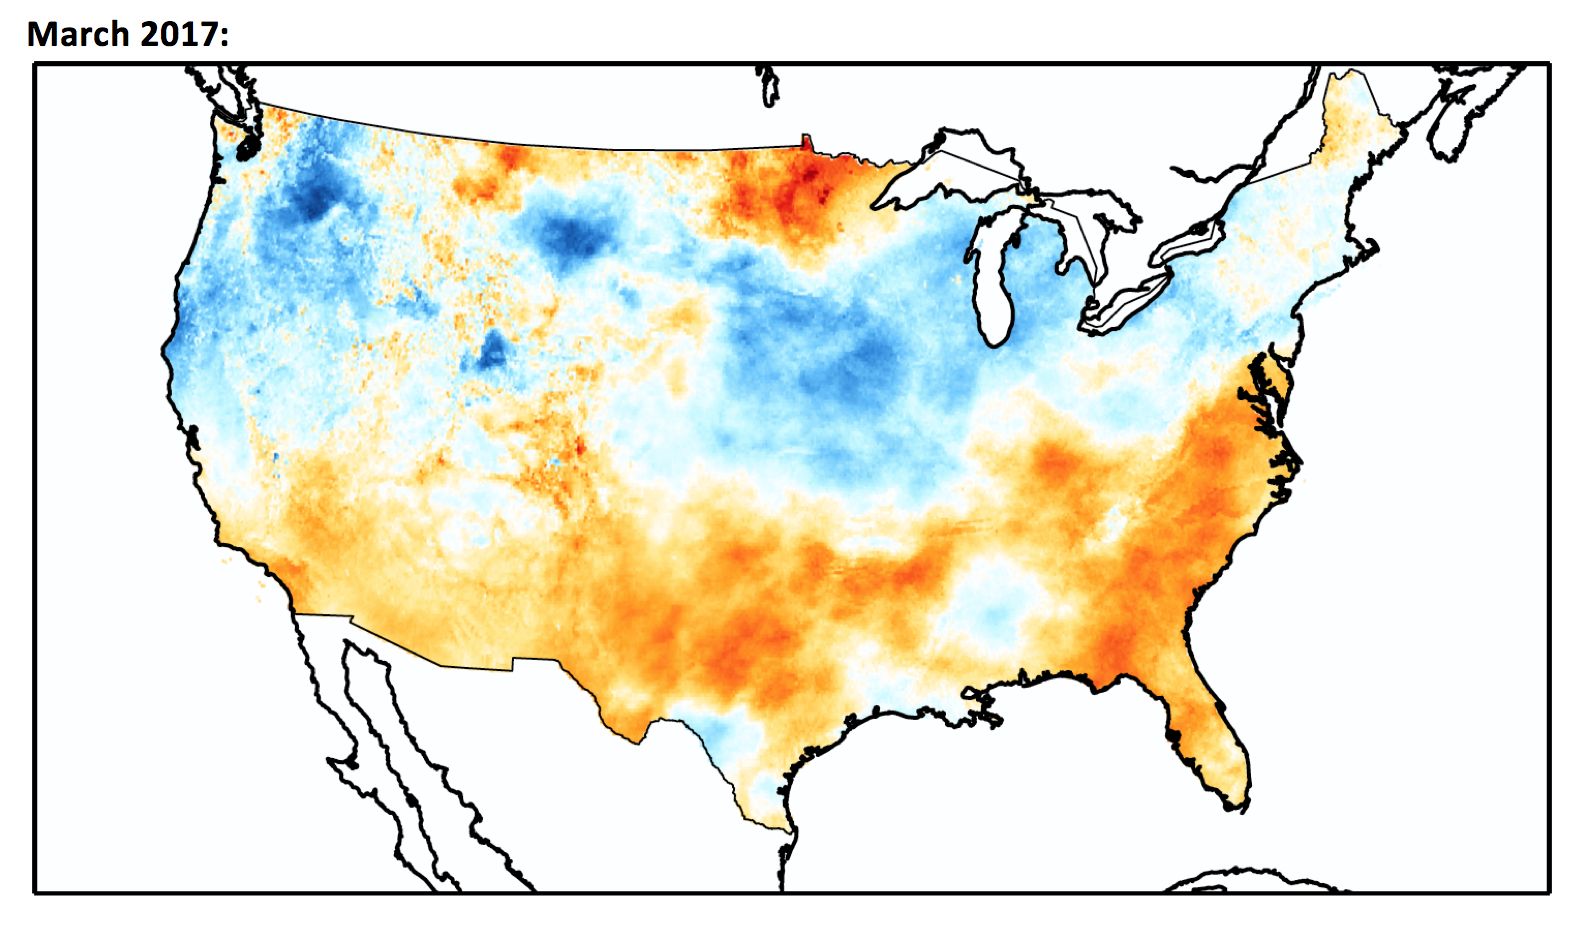
The first quarter ended as it began, with notable extremes in precipitation, wildfires in the Southeast, and severe weather reported across the South and Southeast. Unlike the February pattern, the GHI anomalies for March appear to be oriented along a north-south divide. Positive anomalies were predominant in the South, and negative anomalies were experienced in the North, with the exception of northern Minnesota, North Dakota and Montana.
The positive GHI anomaly in the South is consistent with a region of low precipitation, stretching from Southern California to Florida, which saw 5 percent or less of average 20th-century levels, according to NOAA’s temperature and precipitation maps.
Meanwhile, wetter-than-average conditions in the Northwest, Northern Rockies, Central Plains and the Midwest help explain the negative GHI anomaly in that region. The above-average precipitation was accompanied by severe weather, with 176 tornadoes recorded, more than twice the 1991-2010 average. While some tornadoes were reported in Texas, the majority were located in the South, as well as in the central Ohio Valley region.


 41
41
 15
15
 9
9