
SolarCity (Nasdaq: SCTY), a provider of distributed energy, just announced a $500 million lease financing agreement with Goldman Sachs (NYSE: GS). That translates to more than 100 megawatts of solar power.
The combined lease is the largest of its kind for U.S. residential rooftops.
SolarCity allows consumers to get electricity from grid-tied solar rooftops at lower rates than the utility through leasing or power purchase agreements (PPAs). SolarCity specifically mentions the goal of opening up solar to consumers with lower credit scores in this release.
Jimmy Chuang, SolarCity’s VP of structured finance, said, “We expect to be able to expand our offering to a broader customer base by lowering the credit requirements even further in future financings," according to a statement.
Nicole Litvak, a researcher at GTM Research, notes that SolarCity, as discussed in its recent earnings call, is "delivery-constrained." She adds that SolarCity didn't raise its 2013 guidance even though it beat Q1 expectations -- so this fund won't help SolarCity install any more than planned unless the company can scale up its installation operations. Litvak's research finds that SolarCity is number one in California but has surrendered the market leadership role in Massachusetts to upstart Vivint.
Scott Burger of GTM Research adds, "When SolarCity says it is delivery-constrained, it is saying that it has more business than it can deploy boots to install. This goes back to the statement about wanting to decrease its backlog (i.e., projects booked that it can't install at the moment). Raising a fund like this will presumably continue to drive down Solar City's cost of capital, which in turn increases the retained value of any lease or contract."
***
SolarCity (SCTY) announced its Q1 2013 financial results earlier this week, in its first full quarter as a public company.
Here's a transcript of the call.
Highlights:
- Investments in solar energy systems of $138.2 million, bringing the cumulative total to date to more than $1.14 billion
- Deployed 46 megawatts, up 12 percent from Q1 2012 and exceeding guidance of 41 megawatts
- Cumulative 333 megawatts deployed
- Customer base grew 106 percent year-over-year to over 57,400
- Increased long-term contracted cash flows to $1.22 billion
SolarCity continues to attempt to educate investors on the SolarCity business and value proposition, noting in its release, "Due to the long-term nature of operating lease contracts -- of up to 20 years -- [SolarCity] believes GAAP income statement accounting does not accurately reflect new sales activity." It views the following operating metrics as a better representation of its business outlook:
- Estimated nominal contracted payments remaining of $1,222 million at March 31, 2013, up 10 percent from $1,109 million at December 31, 2012
- Retained value of $569 million at March 31, 2013, equating to retained value per watt of $1.25 per watt at March 31, 2013
The income structure of a company like SolarCity, with a business model based on solar leasing, power purchase agreements, and bank funds for rooftop solar, is complex. Here comes some accounting:
SolarCity defines "Retained Value" as the forecasted net present value of estimated Nominal Contracted Payments Remaining and estimated performance-based incentives allocated to SolarCity, net of amounts the firm is obligated to distribute to its fund investors, upfront rebates, depreciation, renewable energy certificates, solar renewable energy certificates and estimated operations and maintenance, insurance, administrative and inverter replacement costs. This metric includes Energy Contracts for solar energy systems deployed and in Backlog. SolarCity's calculation of retained value assumes a discount rate of 6 percent.
GAAP figures have SolarCity with these Q1 outcomes:
- Total revenue up 21 percent year-over-year to $30.0 million
- Gross profit margin of 42 percent
- Loss from operations was $21.8 million versus $14.6 million in Q1 2012
For Q2 2013, SolarCity expects to deploy between 48 megawatts and 53 megawatts. The firm stayed steady on its 2013 guidance of 250 megawatts with Q2 Lease and Solar Energy Systems totaling $21 million to $28 million at a gross margin between 40 percent and 55 percent.
The company anticipates being net-cash-flow positive by Q4 2013, as well as having a positive net cash flow in Q2 2013.
When confronted with some technical slide-related issues at the beginning of the call, CEO Lyndon Rive said, "It's a good thing we're not selling software and we're selling energy."
Here's a history of SolarCity revenues:
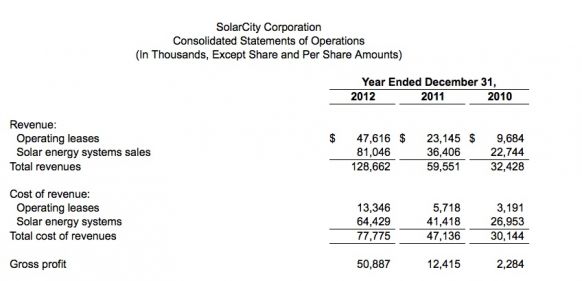
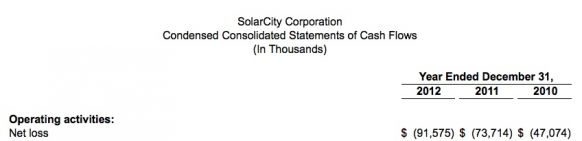
But losses also surged to $91.5 million in 2012.
Andrew Krulewitz, a Solar Market Analyst at GTM Research, provided this analysis of SolarCity's performance earlier this year:
SolarCity by the Numbers
For 2013, SolarCity announced that it expects to deploy 250 megawatts of new generating capacity, with an increased focus on the residential market (190 megawatts). The following figure charts the company’s quarterly installations, both residential and non-residential, and its relative share of the U.S. market according to GTM Research forecasts and company figures. Q4 2012 is the only quarter for which the company has released installation figures by market segment; it also reported full-year 2012 installations by market segment. By combining this information with project-level installation data from nine start markets (which accounted for 78 percent for all U.S. distributed PV demand in 2012), we were able to estimate SolarCity's quarterly installation totals. Assuming a similar growth pattern and that SolarCity achieves its megawatt goal in 2013, the company's relative market shares will be an impressive 27 percent of the national residential market, but just 4.9 percent of the non-residential market, which is down from 2012. Of all new distributed PV, market share will climb to 12.9 percent.
SolarCity Installations by Market Segment & Relative Market Shares, 2012-2013E
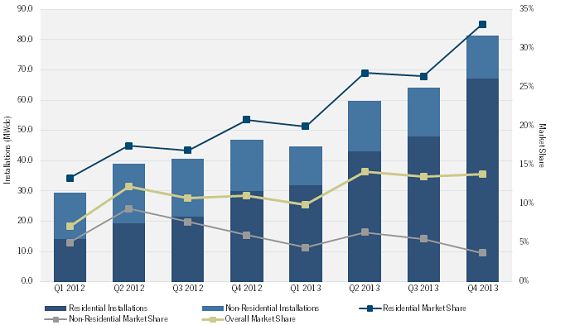
Source: SolarCity, SEIA/GTM Research U.S. Solar Market Insight report, GTM Research U.S. PV Leaderboard
Expanding Residential Presence
SolarCity offers residential solutions in fourteen different states. In the two largest residential markets, California and Arizona, SolarCity is far and away the leading installer (not to be confused with the financier category, as detailed in the GTM Research U.S. Residential Solar PV Financing report). In growing residential markets, such as New York and Massachusetts, the company has quickly expanded its presence, and if it isn’t already the top installer, it’s in the top five and likely to move up. The only major residential market in which SolarCity is not a leader is Hawaii; there, local installers have performed better than national firms. The company’s expanding East Coast presence also allows it to take advantage of smaller pockets of demand, such as Maryland and Washington, D.C., and nascent markets such as Connecticut.
SolarCity Residential Installer Market Share and Rank in Select State Markets
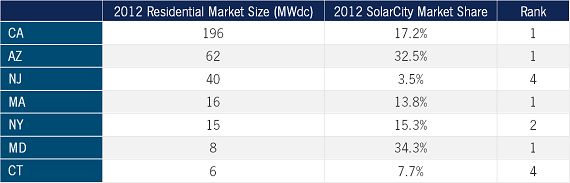
Source: SEIA/GTM Research U.S. Solar Market Insight report, GTM Research U.S. PV Leaderboard
Decreasing Non-Residential Focus
In the company’s 2013 guidance, SolarCity expects non-residential deployments to be 60 megawatts on the year. This is down from 71 megawatts in 2012. GTM Research predicts that the non-residential market will continue to grow in 2013, so why is SolarCity shying away from opportunity here? Potential reasons include:
- The non-residential market is significantly more volatile than the residential market and project timelines are much longer compared to a 5-kilowatt project on a single family home, making financial planning more difficult.
- Compared to residential customers, commercial, industrial, and municipal customers are often subject to different electricity rates and rate structures, which can alter SolarCity’s value proposition and profitability significantly.
- Large public projects, particularly schools and municipal sites, are often put out to bid; winning RFPs is a time-consuming process, increased competition drives down margins, and many systems are financed with bonds, so it’s often a cash sale.
- SolarCity’s business is based on owning and operating systems, but the non-residential market has not seen the same steady growth of third-party ownership as the residential market. In California, where the company installs the most non-residential capacity, SolarCity’s cash sales have increased dramatically since the end of 2011 (see figure below), and according SolarCity’s S-1, direct system sales are less profitable than leased systems (15 percent vs. 68 percent gross margins).
SolarCity Non-Residential Installations: Leased vs. Direct Ownership in CA, 2011-2012
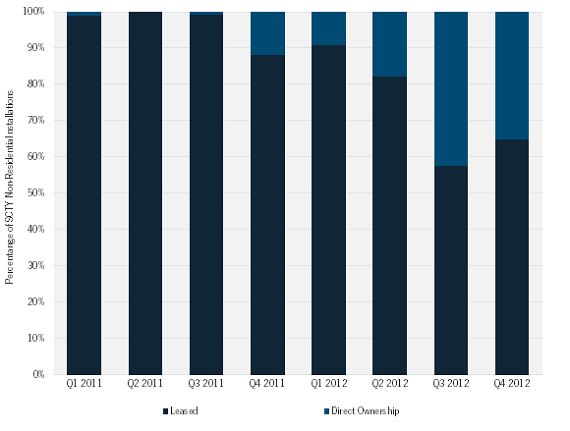
Source: GTM Research
Ultimately, however, 60 megawatts is not an insignificant figure. SolarCity has announced its intentions to continue installing projects with important commercial customers such as Wal-Mart. We expect the company to beat its own estimate in this regard.
Outlook
SolarCity has been in the right places at the right times. The firm rode the California solar wave to build its business. It has honed its costs enough to remain competitive in Arizona, where the residential market has limited incentives and low retail electricity prices (though all 1603 installations reportedly cost $4.98 per watt-DC regardless of location or system components, but that’s a story for another day). It has entered East Coast markets as attractive incentive programs have been introduced (New York, Massachusetts) or are sobering up from SREC insanity (New Jersey). Now, it’s working to generate more sales via non-traditional avenues, including a recently announced partnership with Honda, as well as sales representatives stationed in Home Depot stores.
With lease revenues recognized over twenty years, cost of goods sold over 30 years, and operating expenses in year one, it is tough to distill the company’s true financial performance into one number. Thus, it might be better to look at it this way: if SolarCity achieves its 2013 goal of 250 megawatts, according to GTM Research forecasts, it will have been responsible for the deployment of 12.9 percent of a $6-billion-plus market.
***
Installation data presented in this article is drawn from the SEIA/GTM Research U.S. Solar Market Insight report, and company-specific market share data can be found in the U.S. PV Leaderboard.


 41
41
 15
15
 9
9