
[pagebreak:Stats1]
At Greentech Media, we report on numbers all year long, from market size figures in cleantech to the percentage of Americans who would describe themselves as knowledgeable about energy. Here are some of the most loved (or hated), most read, most commented on and most viral stats of the year:
1. $1.03 per Watt for c-Si
Right around the time that the solar trade war started, Greentech Media’s editor-in-chief Eric Wesoff asked for a quote for 100 units of 200-watt solar panels from Chinaland Solar Energy. The response was that the cost was about $1.03 per watt for crystalline silicon solar panels with a delivery time of about five days.
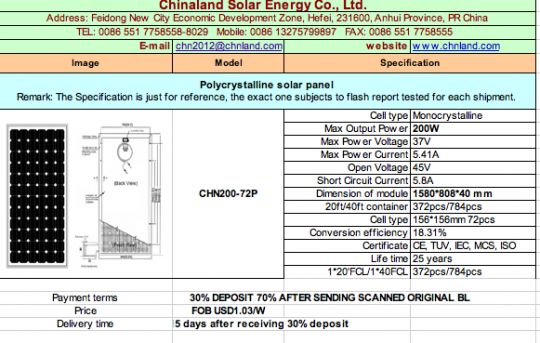
The story garnered nearly 60 comments, but that came nowhere near the 137 comments on an article just a few days later about the official start of the solar trade war. In fact, the debate over the pricing and potential dumping of Chinese solar panels was on full display in Wesoff’s brief article about the pricing, which noted, “No company, Chinese or otherwise, can long survive selling products below cost while running a factory at 50 percent utilization rates. At some point, the Chinese government and Chinese banks might have to let these third-tier firms fail.”
In the eight weeks since the uproar from both sides about the solar trade war, the Buy American Solar Amendment passed in the Senate, but as Wesoff noted in his reporting on the issue, creating jobs and value in America isn’t just about manufacturing.
“More than half of those 100,000 jobs are not manufacturing jobs. They are, in fact, downstream jobs in installation, development, project engineering and the like. For every megawatt of solar panels manufactured, more jobs are created downstream than in the actual manufacturing itself. And it's low-cost solar panels that have spurred adoption of solar roofs.”
Although the trade war started in 2011, it will not conclude this year.
[pagebreak:Stats2]
2. 33 Percent Renewables in California
Oh, the excitement! Oh, the technical questions! The announcement of a 33 percent Renewable Portfolio Standard in April was huge news that will undoubtedly create opportunity and havoc for cleantech sectors in California.
The state is already at about 18 percent, but the next 15 percent will test the grid, the cost of renewables and NIMBYism when it comes to transmission. Many entities are already gearing up for the change. The California Independent System Operator, which oversees the electric grid, has set up a Mission Critical Wing to forecast and adjust for variable levels of renewables at any given time.
The major utilities are also monitoring circuits and making upgrades to prepare for higher levels of electric vehicles and distributed generation.
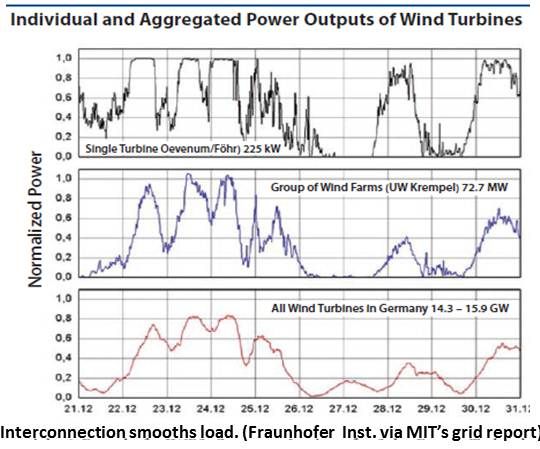
There is also an issue of wires. Khaled Abdul-Rahman, Director of Power System Technology Development at CAL ISO, told Greentech media that adequate interconnection softens variability (as seen in the graph) and can increase for the economic viability of renewables. Without the right interconnections, Abdul-Rahman argued that not only does the resource need to be able to travel to where it’s most needed, but there also has to be a flexible market design to adapt to the changing balance of energy.
And if California can get it right, renewable companies hope that the rest of the country will follow.
[pagebreak:Stats3]
3. Average U.S. Solar System: $5.20/W
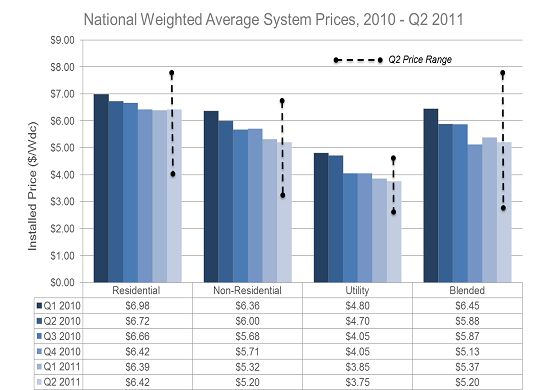
The cost of solar elicits strong responses every time Greentech Media presents a new figure. That was equally true for an article from October (right around the time of the solar trade war announcement) that reported the average weighted photovoltaic installation price decreased just three percent in the second quarter of 2011 to $5.20 per watt, according to GTM Research and the Solar Energy Industries Association’s latest quarterly U.S. Solar Market Insight report.
The residential figure hovered around $6.40 per watt for nearly all of 2011, as residential systems have a lot of non-component costs, which can take a long time to move downward. The utility costs continued to push lower throughout the year, ending at about $3.75 per watt.
[pagebreak:Stats4]
4. 20 Quadrillion Btus of Wasted Energy Annually
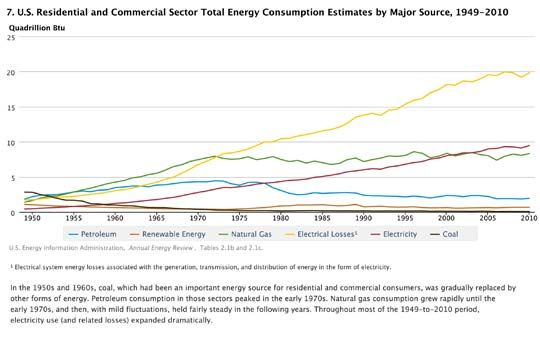
One frightening figure, shown as a far-reaching yellow line in the dense Annual Energy Review 2010 report, was the rate of electrical losses from generation, transmission and distribution of electricity.
That graph tops out at about 20 quadrillion Btu, and perhaps even as much as 26.8 quadrillion Btu, if you consult another figure that also appears in the same report. While much of that loss is “a thermodynamically necessary feature of the steam-electric cycle,” according to the EIA, it is still more than double the amount of electricity that is sold in the U.S. each year.
Some waste heat will always be just that -- wasted. But a more efficient electrical grid, decoupling of generation, and more efficient generation (there were lots of claims in 2011 about the world’s most efficient gas turbine) can help drive down the little yellow line.
[pagebreak:Stats5]
5. Smart Grid Benefits Could Be Worth $2 Trillion
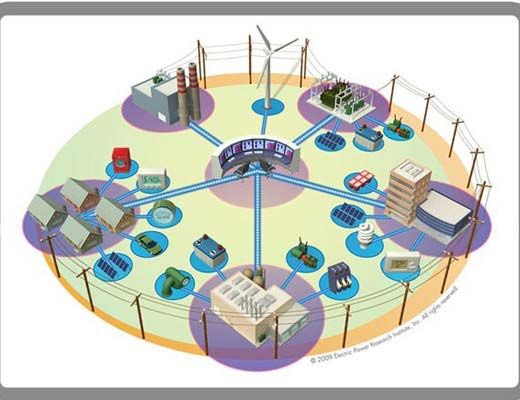
Nobody said building a smarter electrical grid is cheap. But a study from the Electric Power Research Institute did find that the benefits of smart grid outweigh the costs. Although modernizing the grid could come with a price tag of $476 billion (not available on layaway this holiday season), the benefits stand at $2 trillion -- with a T.
Reducing outage times, increasing efficiency on the grid itself (see previous stat about wasted energy) and coupling efficiency measures in buildings with a more intelligent grid could also save a lot of money.
Some utilities, like Vermont Electric Cooperative, have seen swift paybacks for smart grid plans, due solely to more efficient outage restoration -- and fewer outages overall. The question of who pays and who receives the benefit is still being worked out in a piecemeal manner all over the country.
For co-ops like Vermont, it’s an easier business case, because they respond to members, not investors. On the other hand, ComEd and Ameren in Illinois will have to prove their smart grid spending is reaping the benefits promised. California’s three big utilities will have to report on smart grid metrics annually. Expect even more demands for utilities to put their money where their mouths are in 2012.
[pagebreak:Stats6]
6. Enphase Ships 500,000, Then 1M Microinverters
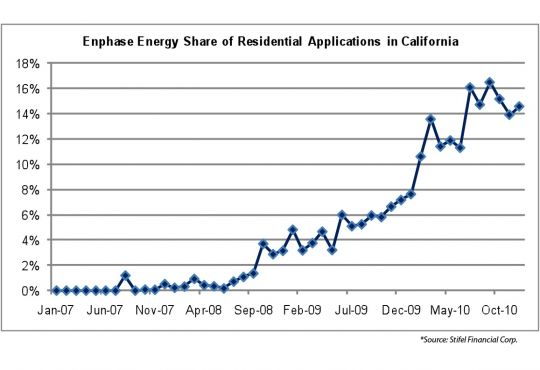
Early in 2011, Enphase Energy announced that it had shipped out 500,000 microinverters and expected to triple its capacity in 2011.
Fast-forward to October and Enphase had shipped its millionth microinverter. The announcement in October also coincided with the announcement that the U.S. had installed a cumulative total of one gigawatt of solar panels.
The news of the half-million sold was of even more interest to our readers than the next half-million shipped in just nine months. Perhaps the latter was a foregone conclusion to some GTM fans, or the news fell during the solar trade wars and Solyndra downfall -- and positive news just doesn’t have the same power as bad news. There is a reason for the journalism adage, 'If it bleeds, it leads.’
But every now and again, it’s important to let good news rise to the top. Not only did Enphase ship its millionth microinverter, it also delivered on its 2011 plans to hop across the pond and move into markets in France, Belgium and the Netherlands. Although Enphase, with an anticipated IPO, is putting up big numbers, it is still playing in a small portion of the solar inverter market, according to GTM Research.


 41
41
 15
15
 9
9