


In 2017, the global solar market will experience a contraction -- something that hasn't happened in 16 years or more. According to GTM Research, global PV installations will shrink by 7 percent in 2017.
But don't fear, Chicken Little, this is just a blip on the radar. Driven by falling system prices, new procurement methods like tendering and auctions, and emerging markets such as India and countries in Latin America, GTM Research forecasts a cumulative average growth rate of 8 percent over the next five years, resulting in a 109-gigawatt market by 2021.
Each quarter, GTM Research analysts put together a quarterly briefing that summarizes the most important findings from their research. We've highlighted their introduction below, but you can also download the executive summary from the briefing here.
Competitive reverse auction tenders continue to proliferate globally
While direct incentives and feed-in tariff programs are fading, GTM Research counts 33 national markets where tendering or auction schemes are in place and an additional 14 markets where there have been discussions about or plans made for them. Tenders will be universally established as the global model for solar procurement from both governmental and nontraditional sources, applying downward price pressure to tariffs globally and establishing a virtual price ceiling for unsubsidized solar.
FIGURE: Markets With Tendering or Auction Schemes in Place, Under Discussion, or in Planning Stages,* Q1 2017

Source: GTM Research Global Solar Demand Monitor
$20/MWh bid in reach as tenders grow more competitive across global markets
In 2016, the Abu Dhabi Water & Electricity Authority (ADWEA) announced a $24/MWh solar bid by Jinko Solar and Marubeni, which is expected to be finalized in the coming month. While the 350-megawatt ADWEA project is not expected to complete construction until 2019 and required a perfect storm of cheap debt, high solar resources, and other levers, price-competitiveness in tenders is intensifying.
With larger economies of scale, continued cost reduction of hardware and soft-cost components, more sophisticated asset management and longer time horizons, a $20/MWh bid isn't entirely out of reach under the most optimal conditions. While regional and global averages will remain far above $20/MWh for the time being, expect more record absolute lows in 2017.
FIGURE: Price-Competitiveness Increasing in Tenders Globally, Q2 2015-Q4 2016

Policy cliffs, curtailment and saturation are shifting developer interest from mature markets to competitive and often unsubsidized tenders in new markets where currency risks are favorable and MDB financing is cheap.
Unlike 2016, demand seasonality may drive some module-price stability in 2017
In 2016, huge first-half demand followed by a second-half dip drove widespread module oversupply and crashing module prices. Although annual global PV demand is expected to fall in 2017 vs. 2016, more balanced early and late demand seasonality may help to stabilize module pricing throughout 2017.
FIGURE: 2017 Quarterly Demand Trends, Major Global Markets

Source: GTM Research PV Pulse
Global megawatt-scale operations and maintenance landscape concentrates
Vertically integrated developers account for the largest share of O&M among existing projects (23 percent), but the market is fragmented among six major vendor categories. Over the next five years, the megawatt-scale O&M market is expected to exceed 501 megawatts, although tightening margins due to falling project pricing and regional market slowdowns will compel continued portfolio consolidation.
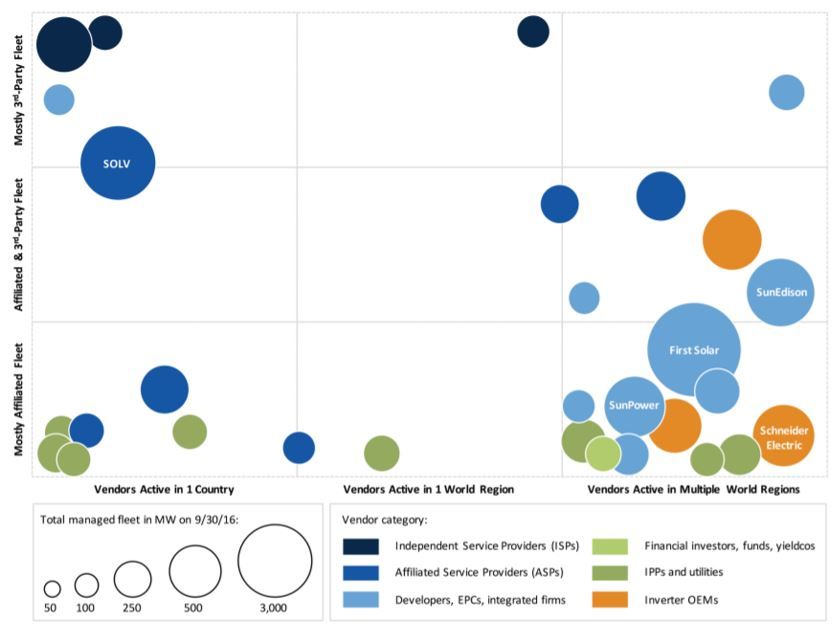
Source: Megawatt-Scale PV O&M and Asset Management 2016-2021
A confluence of favorable conditions pushes U.S. utility fixed-tilt system pricing below $1.00/Wdc in 2017
By the first half of the 2017, utility fixed-tilt PV system turnkey engineering, procurement and construction pricing will land at less than $1.00 per watt (DC). Systems in many low-cost labor environments like North Carolina and Texas will see the lowest pricing. Tracker systems at 1,500 volts could come close, but will average $1.08 per watt (DC) by the second half of 2017.
FIGURE: U.S. Utility PV Fixed-Tilt Turnkey EPC System Pricing, H1 2016-2021E ($/Wdc)

Source: U.S. PV System Pricing H2 2016
PURPA supplants the RPS as the primary driver of U.S. utility PV in 2017
While renewable portfolio standards will continue to drive a significant volume of new utility PV capacity, non-RPS drivers will spur the majority of new solar development for the next several years.
In 2017, PURPA will represent the single largest driver of new capacity additions with projects in North Carolina, Oregon, South Carolina and a handful of other states.
FIGURE: Percent Share of Annual Installed Capacity by Primary Utility PV Driver

Source: GTM Research U.S. Utility PV Market Tracker
U.S. residential PV market to flip to a majority of customer-owned systems in 2017
As more U.S. residential solar customers choose to purchase solar panels rather than lease them, direct ownership is on its way to overtaking third-party ownership and reclaiming its position as the leading solar financing model for the first time since 2011.
According to GTM Research's report U.S. Residential Solar Financing 2016-2021, 55 percent of all U.S. residential solar capacity installed next year will be purchased by customers paying either in cash or with a loan.

Source: U.S. Residential Solar Financing 2016-2021
Premium module brands poised for growth in U.S. residential market in 2017
As customer ownership becomes more popular and local and regional installers gain market share, premium module brands favored in these installations will gain share. GTM Research expects customer-owned systems to account for more than half of residential capacity additions in 2017, and this percentage will increase even more in the years thereafter.
FIGURE: Modules Used by Long-Tail (<3 MW) Installers, Q1-Q3 2016

Source: GTM Research U.S. PV Leaderboard
More than 70% of U.S. residential installations will use module-level power electronics in 2017
The National Electrical Code (NEC) has significantly expanded module-level power electronics (MLPE) adoption and development. In fact, microinverters and DC optimizers have a 90 percent market share of new installations in states with NEC 2014 rapid-shutdown requirements.
California, which accounts for over 40 percent of annual U.S. residential installations, implemented NEC 2014 on January 1, 2017 and will push national MLPE adoption above 70 percent.
FIGURE: U.S Residential Market Inverter Installation Breakdown, 2016-2021E

Source: The Global PV Inverter and MLPE Landscape: H2 2016
U.S. community solar builds on banner year to exceed 400 megawatts in 2017
The U.S. community solar market will reach 410 megawatts (DC) in 2017 following the realization of pent-up demand in states with regulatory and legislative delays.
Utility-led programs will emerge as a primary driver for the U.S. community solar market as western U.S. markets driver near-term growth. GTM Research expects community solar to consistently drive 20 percent to 25 percent of the U.S. non-residential PV market annually through 2021.
FIGURE: Annual U.S. Community Solar Installations by Program Type

Source: GTM Research U.S. Distributed Solar Service
Download the slides here.
***
Want access to the full 65-slide deck and all of GTM Research's solar reports? Contact [email protected] for more information.


 41
41
 15
15
 9
9