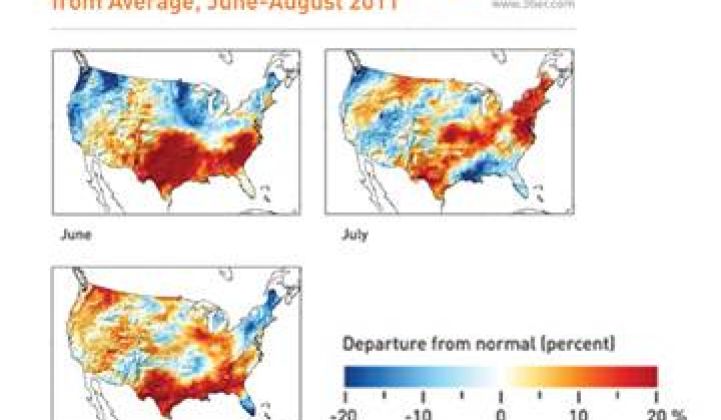
Performance maps of the U.S. sun in June, July and August of this year from renewable energy risk analyst 3TIER show solar irradiance is quite variable -- but contextually variable. Knowing the context reduces variability’s risk for solar builders and investors.
In this year’s three summer months, according to 3TIER’s data, solar irradiance varied from as much as 40 percent above the long-term norm to 20 percent below it. Such variation is not atypical, 3TIER contends, but the financial risk variability introduces can be incorporated into a long-term framework that allows solar investors and developers to effectively manage it.
3TIER maintains a proprietary dataset of continuous solar irradiance calculations covering 12 or more years for any location in the world. Input comes from satellite readings with a 15-minute periodicity, as well as cloud cover datasets for snow, ice and turbidity observations and 3TIER- modeled weather data that includes wind speed, temperature and humidity findings. The dataset is updated monthly for most locations.
3TIER Product Manager Gwen Bender said the information allows owners of, and investors in, distributed generation solar systems of one megawatt or more to limit their exposure to the risk that is associated with the sun’s variability.
In today’s competitive economy, financial institutions and investors will not bankroll a project without having access to a year' of precise solar irradiance data demonstrating the investment’s viability. That data is typically obtained from a ground station at the proposed site equipped with a pyroheliometer or a pyranometer. But terms of financing based on such data could work out badly because ground level observations lack context.
“Cloudy days vary in how cloudy they are and sunny days vary in how sunny they are,” Bender said.
Ground station information that significantly varies from what production will be over the long term can cause a significant misimpression about the project’s potential internal rate of return (IRR). Data taken when irradiance is above the norm could make a lender too enthusiastic or a leave a borrower overextended. Data taken when irradiance is below the norm could cause a good project to go without backing.
3TIER offers lender and borrower a solar assessment product which incorporates both the long term satellite record and ground station data. “What you’re trying to get to,” Bender said of what the product offers,” is knowing the project can make enough money selling power in the lowest of the low years to service the debt.”
There is also a solar reconciliation product that offers risk management to solar system operators.
When the reconciliation product shows a system’s output to be above normal because of above normal irradiance, a prudent system owner might set aside a portion of the return as a hedge against below normal irradiance.
When the reconciliation product shows a system’s output to be below normal but irradiance does not explain that fall off, the system owner is alerted to likely operations and maintenance issues.
The data may be most valuable to concentrating solar power plant operators. “The direct normal irradiance resource generally sees more variability than the global horizontal irradiance and the DNI is what CSP facilities run off of,” Bender said. Given the financing challenges facing CSP developers in today’s marketplace, 3TIER’s information could be determinative.
To demonstrate the extent of the sun’s variability in this era of climate change and extreme weather, 3TIER compared its average irradiance values for the U.S. in the period 1997 to 2010 to its calculations of U.S. irradiance for the 2011 summer months. The variance was then visualized in color-coded maps.
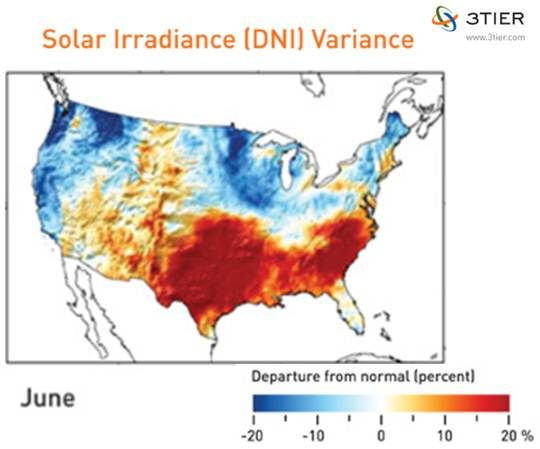
The 3TIER study showed that June’s hot, dry drought conditions in Texas that produced wildfires were accompanied by direct normal irradiance (DNI) values of 15 percent to 40 percent above normal from Texas and Oklahoma to the Carolinas. The West Coast, interior Pacific Northwest, and Upper Midwest had cool, cloudy weather and a DNI that was 15 percent to 30 percent below normal.
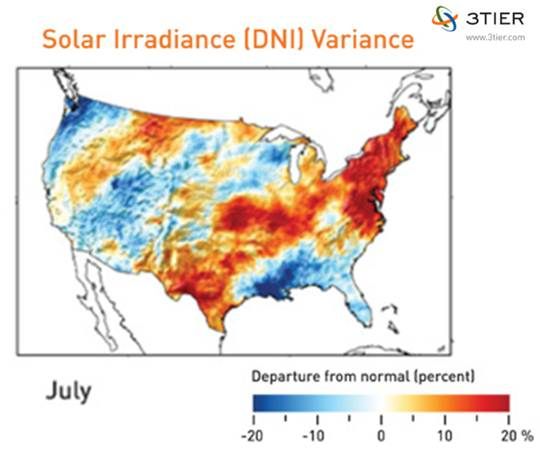
In July, the Texas wildfires raged on and the DNI values over Texas and Oklahoma remained 10 percent to 20 percent above normal. Wet weather along the Gulf Coast caused DNI levels in the Deep South to fall to below average levels and shifted the hot sun northward, resulting in above-normal DNIs from the mid-Atlantic to New England. The Northwest remained cool and wet, keeping DNIs below average, while parts of California and the Northern Rockies got hotter and brighter and developed normal to above-normal irradiance.
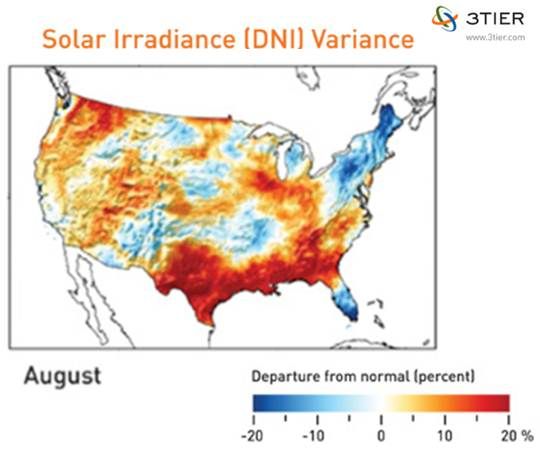
In August, weather in the Northwest, especially away from the coast, cleared, and DNI values rose to 10 percent to 20 percent above normal. Hot, dry weather remained across the eastern U.S., keeping DNI levels 20 percent to 30 percent above normal from Texas to the Ohio Valley. It got dryer on the Gulf Coast and DNI values went up above average, but Tropical Storm Emily and Hurricane Irene kept DNI values from Florida to New England 10 percent to 20 percent below average.
The correlation of weather and DNI tell an impressive story about solar variability -- but also about 3TIER’s ability to quantify it.
“Financial institutions are getting more comfortable with large solar projects,” Bender noted. But the marquee story of Solyndra has also made them more aware of the potential for misguided investment.
To be bankable, a developer’s project must have “a long-term record of solar irradiance correlated to data that has been collected at the site,” Bender said. “You want to know what’s happening right now -- and you want to know it in the context of what’s been happening in the last 10 years.”


 41
41
 15
15
 9
9