The ability to track and respond to real-time grid power prices is being programmed into a growing number of grid-edge devices, such as electric-vehicle chargers, smart thermostats and appliances, and behind-the-meter battery control systems. But there’s the price of grid electricity, and then there’s the greenhouse gas emissions profile of grid electricity -- and the two are not always the same.
That’s a problem for anyone hoping to turn smart devices to the specific task of greening the grid, at least in a verifiable way. But with the right mix of grid data and emissions data, it should be possible to turn price-responsive assets into emissions-responsive assets -- and give green-minded consumers and corporations another reason to buy into smart energy controls.
That’s the proposition behind WattTime. Founded in 2014, the Berkeley-based nonprofit started out sending text alerts to customers interested in turning down household energy use during times of high-emissions grid power. But it's since grown to delivering its data to university energy management systems and smart EV chargers, and exploring the potential to share it with scientists at the Department of Energy’s Pacific Northwest National Laboratory -- and as a nonprofit, it's making its data available via APIs for others interested in trying it out.
Last month, WattTime launched its first commercial application with EV charging startup eMotorWerks, in the form of the JuiceBox Green 40. The Wi-Fi-networked and cloud-controlled 240-volt charger comes with eMotorWerks’ price-sensitive charging controls. But it can also plot out an overnight charging schedule that could reduce its emissions profile by as much as 50 percent, compared to “dumb” charging systems, WattTime co-founder Gavin McCormick said in a recent interview.
“The focus of our technology is, based on where you are and what time you’re plugging in, finding out where your marginal power plant is,” McCormick explained. A “marginal” power plant is the generation resource on top of the “stack” of all the sources being called into play to meet grid demand at that moment, whether it’s a coal- or natural-gas-fired power plant or a wind or solar farm.
WattTime’s technology builds on work underway at Yale, Carnegie Mellon University and at U.C. Berkeley, where McCormick and WattTime co-founder Anna Schneider earned their Ph.D.s, he said. That work is centered on analyzing data from the Continuous Emission Monitoring System that all power plants maintain under U.S. Environmental Protection Agency rules.
These projects have mainly focused on historical analysis, he said. WattTime takes the additional step into real-time data from the Open Access Same-Time Information System. That’s the federally mandated platform that allows data exchange between regional grid operators like California Independent System Operator and the Energy Reliability Council of Texas.
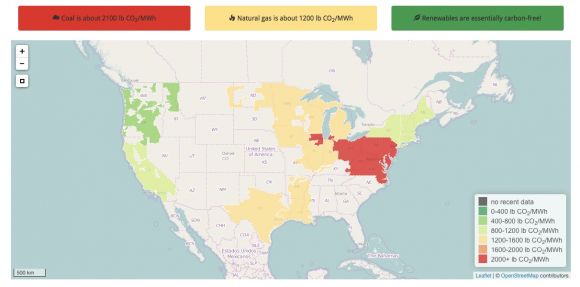
With that data, “We’re actually observing the historical record, and confirming that different power plants are powering up and down, at the turbine level, at the unit level,” he said. Combining these two data sets allows WattTime to tease out forward-looking predictions of what marginal CO2 emissions will be on a per-megawatt-hour basis at 5-minute intervals. (Here's a link to WattTime's map that tracks average marginal emissions in grid operator territories where it has available data.)
That’s a relationship that’s very difficult to nail down with any certainty, according to Karen Studarus, a power systems engineer at the Pacific Northwest National Laboratory in charge of a program working on the challenge of tying emissions to grid data.
“It can be so hard to tease out, particularly where your operations don’t map neatly to fuel prices,” she said. For example, in the Pacific Northwest, which is largely powered by dams, “the way you operate the hydropower plants on the Columbia River is largely driven by non-power constraints,” such as when dams need to be curtailed to allow salmon to migrate upstream, she said.
What’s more, every generation source on the grid can be said to share the overall burden of supplying electricity to every building and device connected to it, she said. “What’s powering my laptop right now was generated by a mixture of a coal plant in Montana, a hydro facility near the Canadian border, and some concentrating solar installations down near Phoenix.”
Finding the low-emissions needle in the grid-data haystack
Even so, sometimes high prices and high emissions mostly match up. In California, for example, grid operators meet spikes in daily electricity demand by dispatching “peaker” plants. These natural-gas-fired combustion turbines put out more CO2 per unit of power than the more efficient combined cycle gas turbines running most of the time -- and way more than the zero-emissions solar power that’s increasingly serving a portion of the state’s daytime grid needs.
That makes it a bit easier for software to link high peak prices and high emissions levels in California. Startup Ohmconnect, which is piloting home-to-grid energy control systems in the state, can tell users when their decision to turn down energy use has reduced the dispatch of local peaker plants, for example.
But at other times, the two are disconnected. That can happen in the Midwest overnight, when power may be supplied largely by coal-fired power plants, or by wind farms capturing nighttime breezes, WattTime's McCormick said. That mix can shift from moment to moment, and because both are cheap, off-peak supply resources, there’s not much difference in how they’re priced -- but with WattTime’s software, “the JuiceBox Green can pick those apart,” he said.
Val Miftakhov, CEO of eMotorWerks, noted that matching EV charging to the ups and downs of the wind-coal mix “can be the difference between an EV that’s cleaner than a gas-powered car, or an EV that’s dirtier than a gas-powered car.” We’ve covered the ongoing controversy over EVs and their emissions profile, which boils down to how clean or dirty the electricity they’re charging with happens to be.
WattTime’s predictive algorithms could potentially direct EV charging or other variable loads to take power when wind power is predicted to exceed overall grid demand and be curtailed, McCormick said. That would equate to achieving a 100 percent reduction in CO2 emissions compared to standard grid power.
But even in a less extreme situation, like peaker-plant avoidance in California, WattTime should be able to achieve a roughly 50 percent reduction in CO2 intensity for the loads it’s controlling, he said.
This kind of information could help utilities align their grid investments and resource planning with their CO2-reduction goals, PNNL’s Studarus noted. “There hasn’t been a whole lot of work done on the greenhouse gas consequences of smart-grid infrastructure work,” she said, though PNNL has done research on the topic, and is working with DOE on expanding that analysis for utilities, regulators and companies with sustainability goals.
If enough loads were controlled in this manner, it might be theoretically possible for them to lower grid demand sufficiently to avoid having to turn on peaker plants in the first place, Miftakhov noted. Of course, that’s a stretch, considering the scarcity of price-responsive appliances, air conditioners, and other electrical loads today.
But with states like California and New York revamping demand response and distribution grid regimes to allow individual homes and businesses and distributed energy resources to play a more active role, it’s possible that the number of devices that could make use of software like WattTime’s will grow quickly.
“We’re trying to keep the focus on EVs right now,” McCormick said. “But there are other loads that are absolutely applicable.”


 41
41
 15
15
 9
9