
The global installed capacity of megawatt-scale PV plants is expected to grow by 70 percent in 2014, from 26.8 gigawatts in January to an estimated 45.8 gigawatts by the end of the year. In the report Megawatt-Scale PV O&M and Asset Management: Services, Markets and Competitors 2014-2018, GTM Research and SoliChamba Consulting analyze 80 players active in Europe and North America managing a combined total of 24.8 gigawatts of utility-scale PV plants.
Project developers and EPCs account for the largest share of the global analyzed O&M fleet capacity (35 percent), followed by vertically integrated solar firms (27 percent), independent power producers (16 percent), inverter manufacturers (11 percent), independent O&M providers (8 percent), and funds/owners (2 percent), as illustrated in the chart below.
Developers, EPCs and vertically integrated companies have a natural advantage since they tend to be the initial O&M provider for new plants, at least during the initial warranty period.
FIGURE: Analyzed Global O&M Fleet by Category (MW)
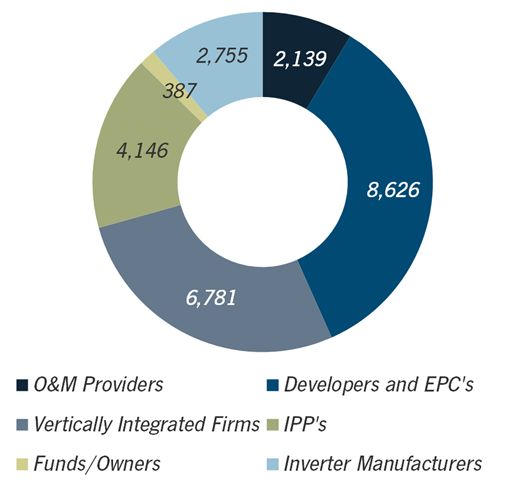
Source: GTM Research and SoliChamba Consulting
Independent O&M firms grew both in number and in size in 2014. In the GTM report, a firm is only considered to be an independent O&M provider if it has no financial ties to any company that develops/builds/owns/finances plants or supplies PV equipment. A growing number of EPC firms manage O&M with a separate subsidiary and market themselves as independent O&M providers; however, most of them still rely heavily on contracts for plants they built.
The chart below presents an overview of the global competitive landscape (limited to the top 58 European and American vendors that were managing at least 100 megawatts of megawatt-scale plants under O&M agreements as of September 2014).
The chart is organized horizontally to illustrate the global diversification of each firm’s O&M portfolio (geographically concentrated on the left, diversified on the right). Concentration level is measured by the largest percentage of the vendor’s fleet located in one country. The vertical axis indicates whether the vendor mostly performs O&M on its own fleet (i.e., plants the firm built/developed/equipped or owns) or third-party plants (proprietary fleet at the bottom, third-party fleet at the top).
FIGURE: Global Megawatt-Scale PV O&M Competitive Landscape Overview
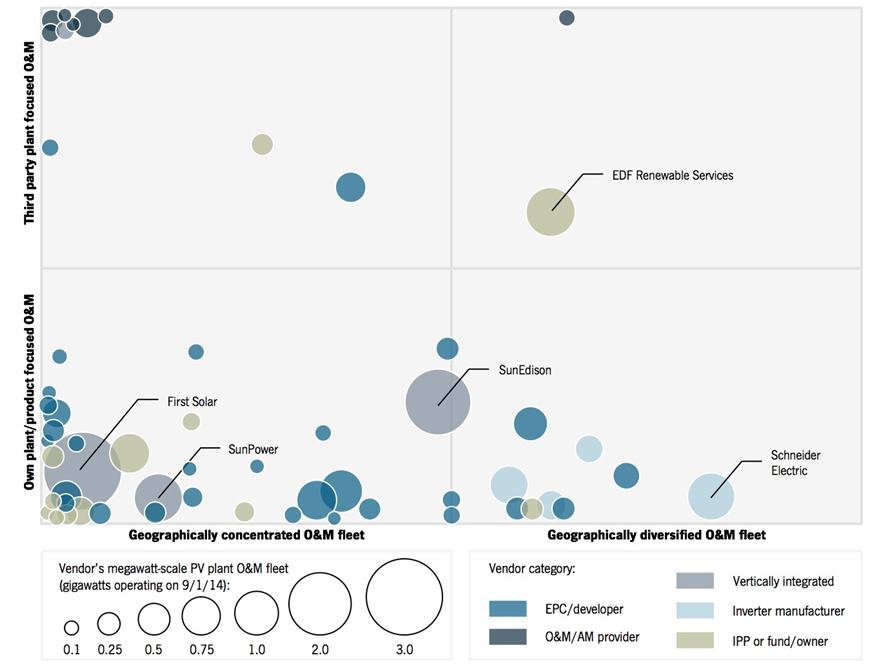
Source: SoliChamba Consulting and GTM Research
The top five global vendors represent an aggregate O&M fleet exceeding 9 gigawatts of utility-scale plants. First Solar ranks No. 1 with more than 3.1 gigawatts (mostly in the U.S.), followed by SunEdison with 2.2 gigawatts across a more geographically diversified fleet and less reliance on its own plants for O&M business. EDF Renewable Services, Schneider Electric and SunPower rank third, fourth and fifth, respectively, each managing approximately 1.2 gigawatts. EDF RS stands out with a share of third-party plants exceeding 50 percent, while Schneider Electric has the most geographically diverse fleet (less than 25 percent in a single country).
This competitive landscape map also reveals that most of the large development, EPC, IPP and vertically integrated firms still rely heavily on their own plant portfolio in order to feed their O&M business. Only five of them operate more than 50 percent of third-party plants and act as de facto independent O&M providers despite being part of a larger parent company.
Independent O&M providers are all grouped in the top of the chart, because by definition, their fleets are exclusively composed of third-party plants, since these firms have no ties to any development, EPC or IPP activities. Independent O&M providers are usually focused in one country or a small number of countries, hence their clustering in the top left corner of the vendor landscape map.
As expected, electrical and inverter suppliers are chiefly focused on managing O&M for plants that use their own equipment, although a few suppliers have fleets with a significant share of third-party-equipped plants.
In terms of geographic diversification, clusters of vendors along the left axis illustrate that most PV O&M vendors are either exclusively active in one country or are doing more than 90 percent of their business in one country. At the other end of the spectrum, Schneider Electric is the only firm whose largest country portfolio represents less than 25 percent of its global fleet.
The report also points out that 2014 was a year of market consolidation, both via mergers and acquisitions and via portfolio-level contracting. Inverter manufacturer SMA acquired the European O&M activities of Phoenix Solar. Chinese module supplier Shunfeng acquired insolvent German developer S.A.G. Solarstrom and its subsidiary meteocontrol (one of the top ten O&M providers), in a move that may turn the company into a vertically integrated solar firm. Solarrus, a U.S.-based asset management provider and owner of True South Renewables, acquired MaxGen Energy Services. Martifer Solar announced the win of a 90-megawatt portfolio in Italy.
These trends are expected to continue in 2015.
***
For more information about O&M and asset management, including market size and forecasts, activities and strategies, costs, competitive analysis, vendor services, and future outlook for each of the major PV markets, refer to the GTM Research report Megawatt-Scale PV O&M and Asset Management: Services, Markets and Competitors 2014-2018.


 41
41
 15
15
 9
9