
Renewable energy’s share of our overall energy mix is at the highest level in over 70 years -- even with the drought-induced decline in Western hydropower output.
In California, increasing solar power generation made up for the shortfall in hydropower production. In fact, solar production was up so much that California became the first state to get more that 5 percent of its electricity from utility solar. This dramatic growth in solar generation has driven the California Independent System Operator (CAISO) to make a regular habit of reporting record solar outputs as more and more plants come on-line.
These numbers from the Energy Information Administration (EIA) and CAISO are helpful. But both miss a huge portion of solar generation.
Solar electricity produced on the utility side (wholesale) of the meter is easily counted by these agencies. But they don't count distributed generation -- the smaller systems located on rooftops. Neither has much visibility on the generation coming from the nearly 700,000 customer-sited PV systems in the U.S.
The EIA has access to data received via its Form 923, which applies only to a sample of plants larger than 1,000 kilowatts-AC. (CAISO has more complete information on utility generation but, of course, this is limited to California and does not include behind-the-meter generation.)
The information from these forms provided a fairly accurate view of U.S. generation when the electricity grid was made up almost entirely of central power plants. But now the data gaps are growing.
So how much are the data collectors missing? Customer-sited distributed PV now represents about 9.2 gigawatts-DC, or about 45 percent of total solar capacity, as shown in the U.S. Solar Market Insight Q1 2015 report from the Solar Energy Industries Association (SEIA) and GTM Research. In other words, our official sources are missing a very significant part of the solar generation picture.
In an effort to provide a more complete estimate of solar generation in the U.S., SEIA and kWh Analytics teamed up to complete an analysis of U.S. solar production, including previously uncounted generation from behind-the-meter systems.
To do this for residential and non-residential systems, kWh Analytics tapped into its database (the industry’s largest independent database of solar production data) to supply monthly “production factors” (aggregate kilowatt-hour yield per kilowatt-DC monitored) by state and market segment. SEIA combined these figures with detailed capacity data to estimate generation from the total known PV fleet for each month in each state for behind-the-meter systems and added this to EIA estimates for utility solar production.
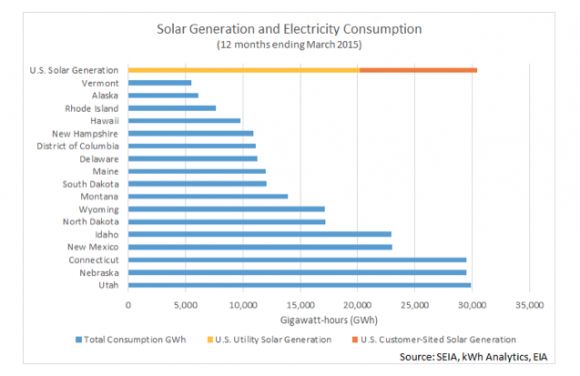
The results are astonishing: we estimate that actual solar production is 50 percent higher than the previous best estimates of solar production. In the 12 months ending in March, solar energy systems in the U.S. generated 30.4 million megawatt-hours of electricity. EIA’s utility-only estimate for the same period is 20.2 million megawatt-hours.
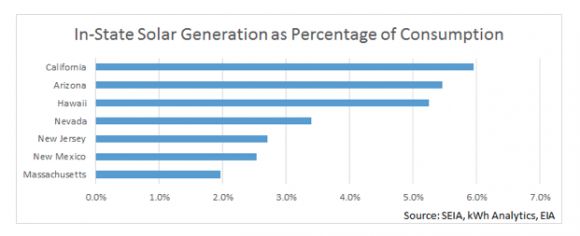
This means that solar power in the U.S. now supplies enough electricity to meet the yearly demand of Hawaii, Rhode Island, Alaska and Vermont combined. Three states can now boast that solar electricity provides more than 5 percent of total consumption within the state: California, Arizona and Hawaii. And total U.S. solar electricity generation now exceeds the consumption of 16 individual states and the District of Columbia.
Why good data is important
Energy is central to just about everything in modern life; that’s why the EIA was created and given the monumental task of tracking vital energy statistics. Accurate information is the lifeblood of effective regulatory and policy decisions at all levels of government -- just look at any action taken by a PUC or FERC and you’ll find heavy use of data on energy.
Or, for a higher-level view, take the title of an April report from the Government Accountability Office: “Electricity Generation Projects: Additional Data Could Improve Understanding of the Effectiveness of Tax Expenditures.” In the report, the GAO recommends that more data be collected in order to evaluate the effectiveness of the federal Investment Tax Credit. Disregarding behind-the-meter production will make solar appear dramatically more expensive.
We can draw another big example from the Environmental Protection Agency’s (EPA) draft Clean Power Plan to regulate carbon emissions from power plants under section 111(d) of the Clean Air Act. In an effort to establish where we are and chart a path forward, EPA relied upon EIA’s estimate of solar generation in 2012 (the last full year available at the time). That figure was 4.3 million megawatt-hours.
In EPA’s “Alternative Approach,” one of two methods for establishing goals in the draft the Clean Power Plan, this produced a target solar contribution of 8.7 million megawatt-hours in 2030 -- less than a third of actual U.S. solar generation will be in 2015. (SEIA and others have pointed out this undercounting of solar and other renewable generation. A revised rule is expected in August.)
Also, it’s just nice to give full credit to the 174,000 solar workers in the U.S. who work every day to build our energy future. Every megawatt-hour counts. Every megawatt-hour from solar saves 172 gallons of water, displaces 1,500 pounds of CO2 emissions and provides energy people can feel good about.
***
Jason Kaminsky is vice president of partnerships at kWh Analytics and Justin Baca is director of research at the Solar Energy Industries Association.


 41
41
 15
15
 9
9