As some of you might know, GTM Research recently published its third report on the global PV supply chain, PV Technology, Production and Cost Outlook: 2010-2015. As with any report of this ilk, competitive analysis features quite prominently in its coverage, and a quite natural question to ask is how module producers across the landscape are positioned across key metrics, which include the following in rough order of importance:
1. Manufacturing cost
2. Bankability
3. Balance sheet strength
4. Module efficiency and performance
5. Sales penetration
6. Local market presence
7. Brand
At a first order, cost, bankability, balance sheet strength, and efficiency/performance would count as the most important in this list. While balance sheet details of firms that are not public or pure-play solar are not generally accessible, the other three can be rolled into a single metric by adjusting the firm’s “raw” module manufacturing cost for differences in the other factors.
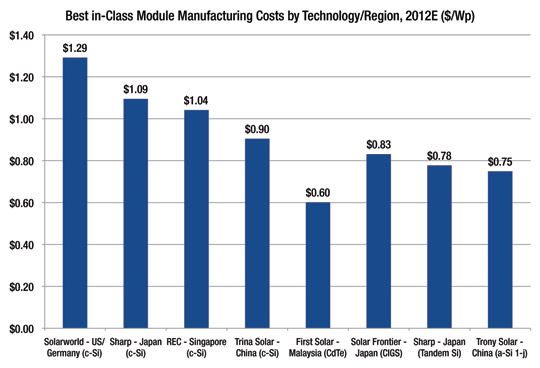
Let’s look at the “raw” (i.e. unadjusted) costs first, as in the figure below, which displays “raw” costs by technology/region for 2012. The firms that are projected to be at these cost levels represent the best (i.e. lowest cost) in their class. As shown, First Solar’s Malaysia plant will still be cost leader for CdTe, and lead other facilities by a fair distance, but the gap will have closed substantially compared to 2010, both on the crystalline silicon side as well as when looking at a-Si and CIGS. On the c-Si side, Trina, Sharp, Solarworld, and REC Singapore are most competitively positioned in China, Japan, US/Europe, and the rest of the world respectively. CIGS is represented by Japanese producer, Solar Frontier, while Trony and Sharp top the list for single and tandem-junction amorphous silicon.
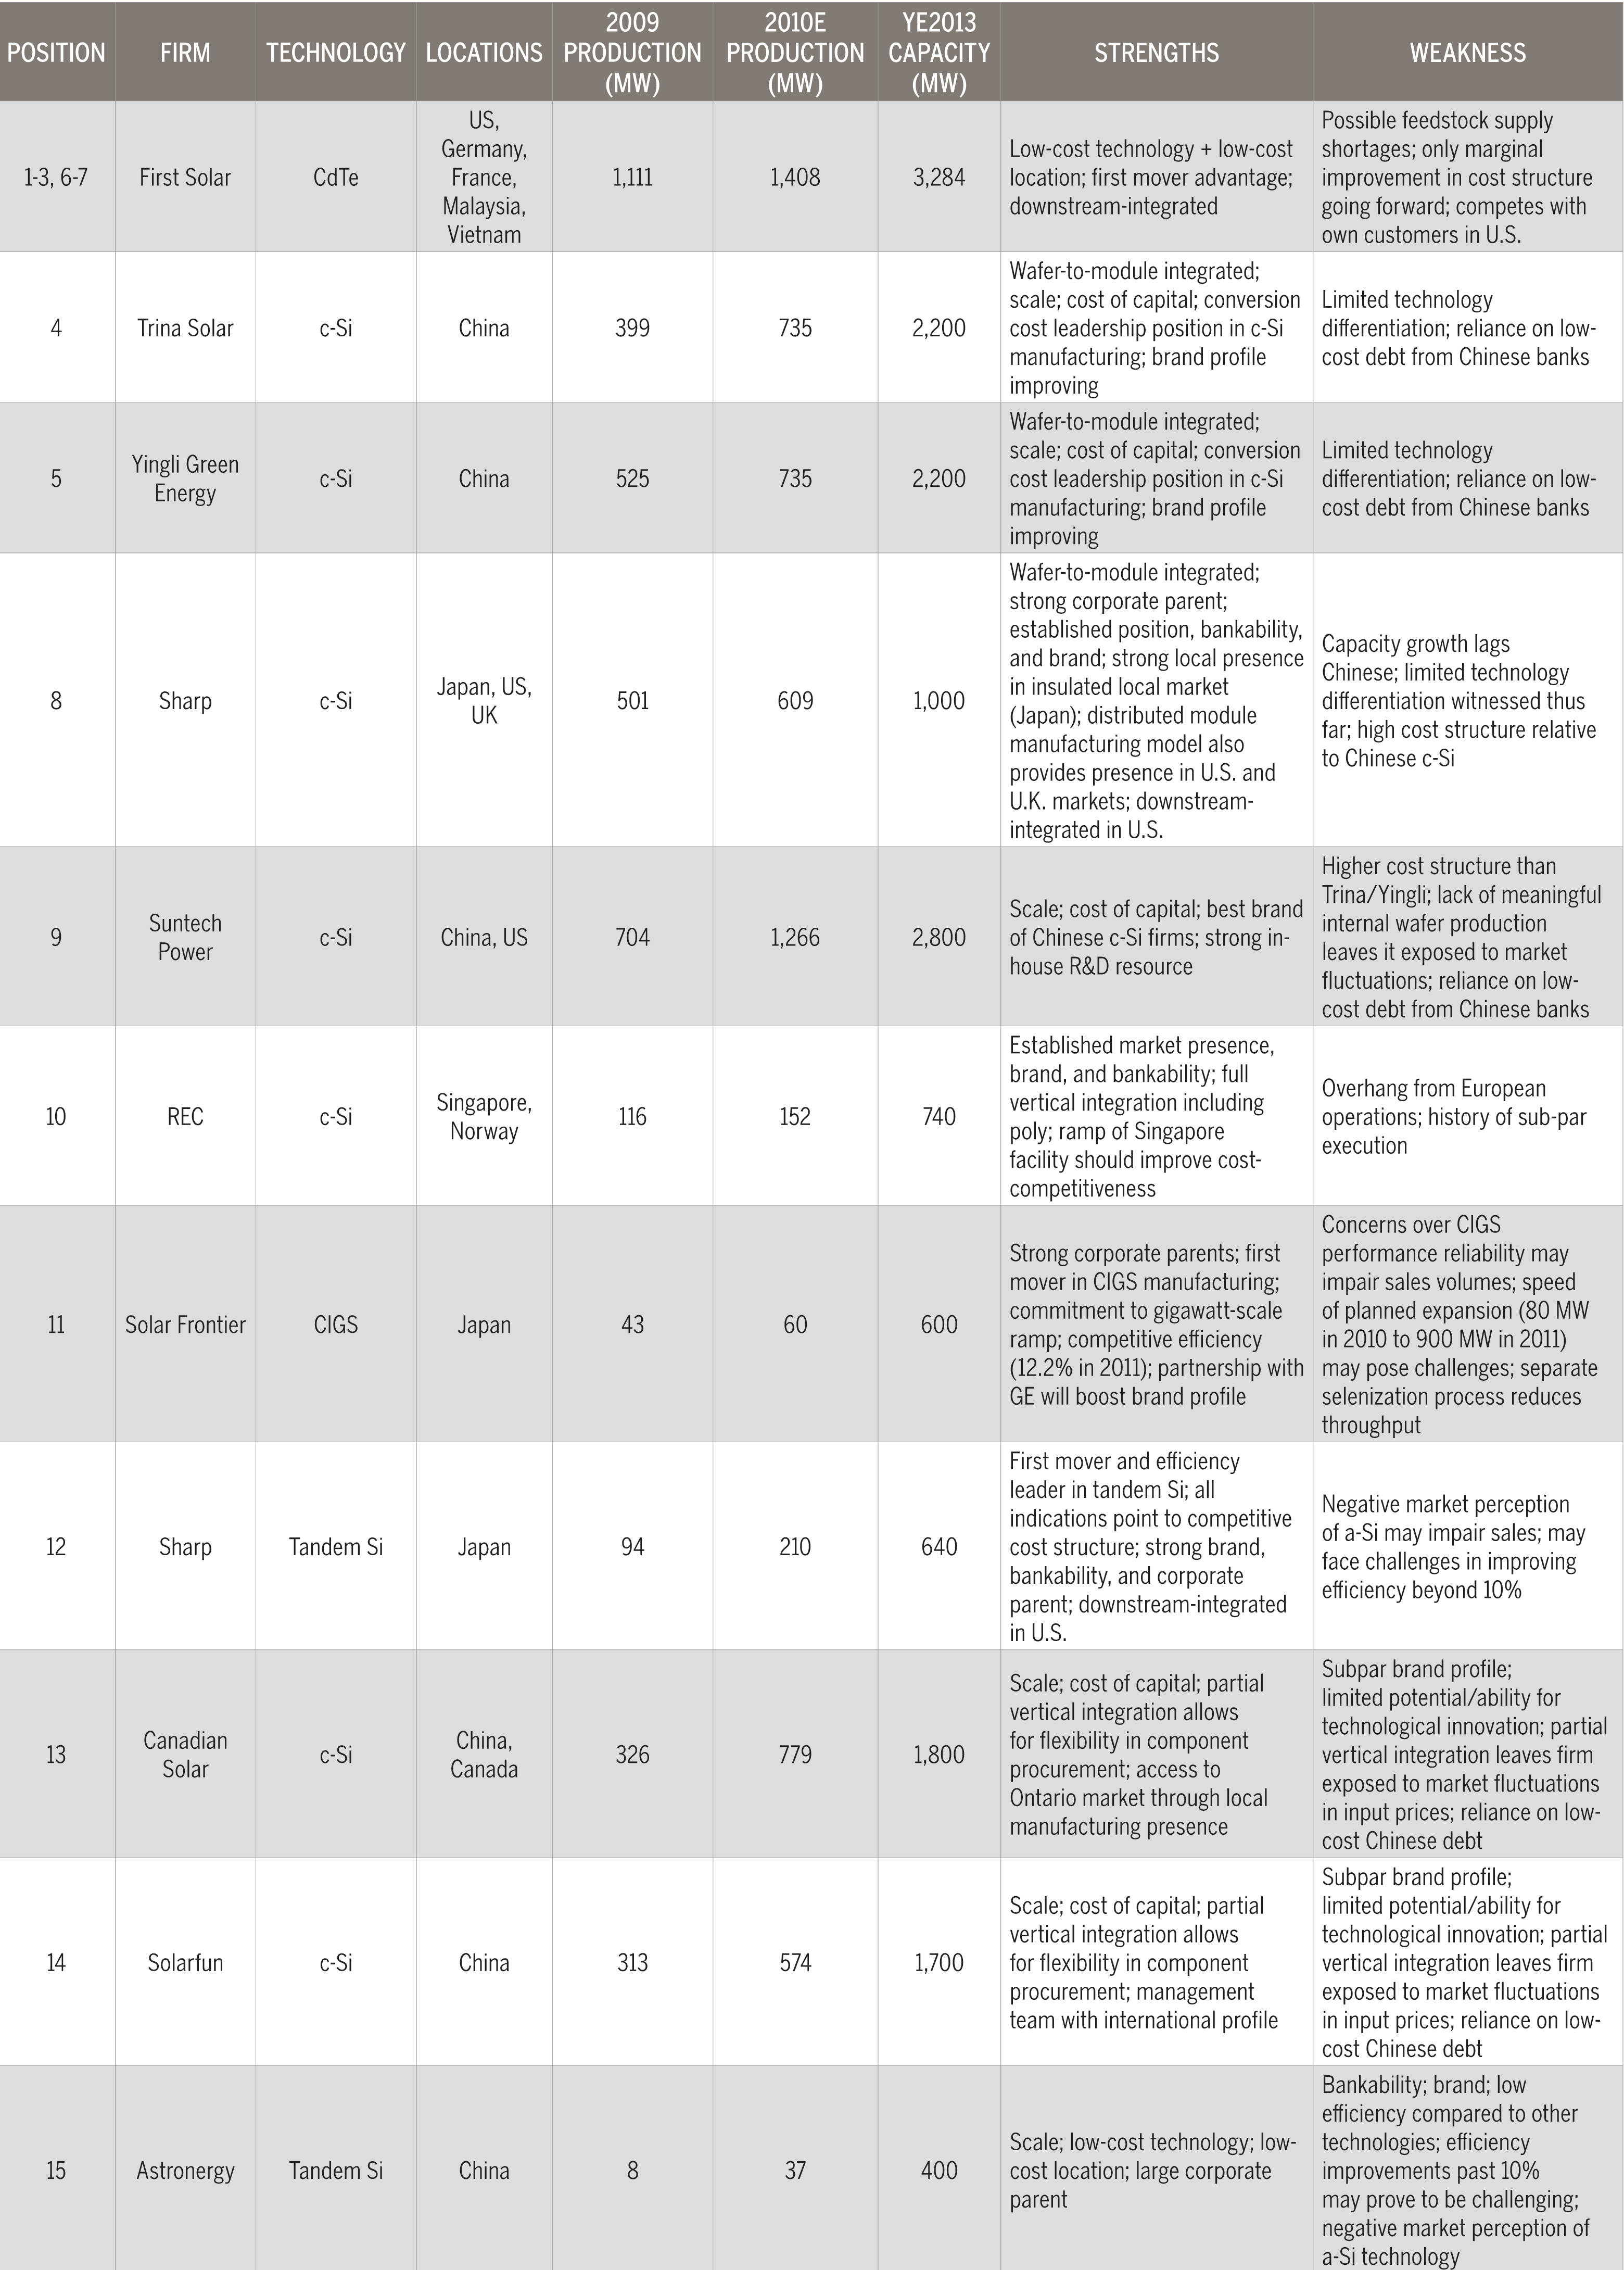
Now let’s incorporate efficiency, performance, and bankability into the picture. The figure below lists the top fifteen most competitive module suppliers in 2012 based on their efficiency/performance/bankability adjusted module costs, and assesses their competitive strengths. The adjusted cost metric is not comprehensive, as it does not capture brand, sales penetration, local market access, and financial strength. Players such as Solarworld, Sharp, and SunPower, which score well on all of these metrics, would therefore understandably feel aggrieved by these results; nevertheless, it provides a sound starting point. It is interesting to note that every cost archetype, bar single-junction amorphous silicon, is represented here. Including SunPower, there are ten c-Si firms on the list of which seven are Chinese, the other two being Sharp and REC. Solibro and Solar Frontier represent CIGS, while Sharp and Astronergy represent tandem-junction Si. In all, these fifteen firms will manufacture almost half of expected 2010 module production of 15 GW, and 38% of 2013 estimated module capacity of around 45 GW.
This article contains excerpts from GTM Research's recently published global PV supply chain report, PV Technology, Production and Cost Outlook: 2010 - 2015. The report addresses technical characteristics, production/capacity volumes, facility-specific manufacturing costs, supply-demand dynamics, and competitive positioning across all relevant PV technologies and nearly 200 wafer, cell, and module firms. For more on the report, go here.


 41
41
 15
15
 9
9