The following is an excerpt from the introduction to GTM Research's recently published report, titled PV Technology, Production and Cost: 2012-2016 Outlook. For more information on the report, click here.
The 2009 edition of this study was titled “The Anatomy of a Shakeout.” It was written during an uncertain time, when the constraint that had limited the growth of the industry for many years -- namely, polysilicon -- was unwinding, and very quickly. In part, this was due to the ongoing financial crisis, which had knocked global installations -- so dependent on the availability of finance -- off a cliff. Along with most of the industry, we predicted that the solar industry was entering a new era, one of structural oversupply and rampant consolidation, from which it would not recover easily.
How wrong we were. On the contrary, the industry bounced back strongly in mid-2009, and 2010 turned out to be the industry’s most successful year in memory, marked as it was by booming installation growth, supply chain stability and attractive profit margins. We had badly underestimated the tremendous appetites of markets with generous feed-in tariffs -- primarily Germany and Italy -- for PV. Over 20 GW of systems were constructed in 2010 (although only around 17.5 GW of those were connected to the grid), compared to mid-year analyst estimates of around 12 GW on average. Our IRR models may have been a little off; we may have underestimated how much the Chinese were able to lower processing costs; we didn’t understand this thing called 'bankability' (which protected many high-cost manufacturers for a while) very well; and we didn’t really have an accurate, even semi-quantitative, understanding of the relationship between pricing, incentives, finance and demand.
Fast forward three years, and we seem to be in familiar territory: the same gaping supply-demand chasm to which there seems to be no end in sight; prices at break-even levels or worse for most of the industry; and a global finance bottleneck replaced with the rapid and irreversible evaporation of support for feed-in tariff programs in the markets that have mattered. Only this time, it really seems to be happening. Quarter upon quarter of losses, an ever-growing list of insolvencies and plant closures, dangerously thin balance sheets, with no end in sight: is this is the long-predicted shakeout, the inevitable correction of a subsidy-dependent industry that has grown too far, too fast? If so, how will the competitive landscape evolve over time? Or, like in 2008, could we be wrong about the shakeout once again?
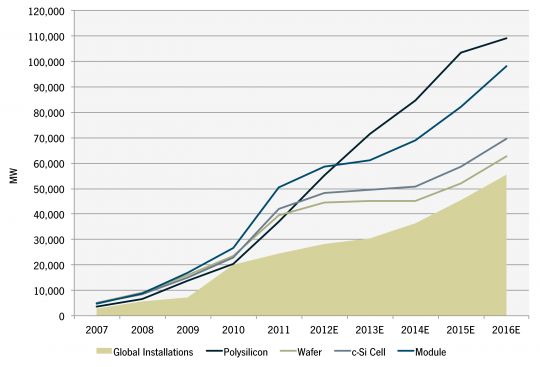
Figure 1: Ramped PV Manufacturing Capacity vs. Global Installations, 2007-2016E
A Brave New World
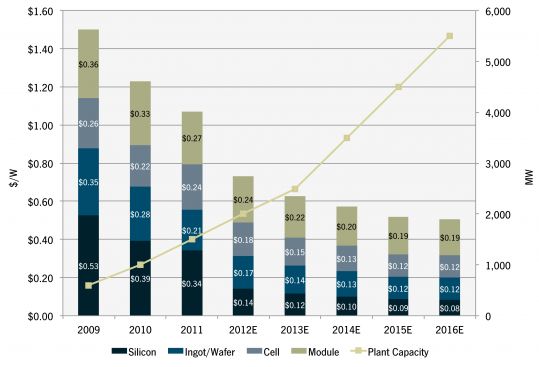
Truth be told, we are not a long way farther along in developing an understanding of the PV market than we were back in 2008. But while we don’t know exactly what works, we do know a lot about what doesn’t work. We don’t plan to underestimate the cost reduction potential of c-Si technologies going forward. That industry has sheer momentum behind it in terms of interested, well-capitalized parties, that technology innovation will happen at breathtaking speed, helping to push c-Si module costs toward the $0.50/W mark at 17% module efficiencies over the next half-decade. We also don’t plan to underestimate the lucre that even cooling uncapped FIT markets still have, especially in an era when system costs are fast approaching $2.00/W. We also don’t think that pricing and demand have a nice, simple relation in terms of elasticity: customers will wait to purchase equipment for months if they think prices will come down further, but then install gigawatts of PV in a few weeks if those weeks precede a major tariff reduction. For this reason, there will continue to be short periods when demand peaks to levels that exceed available supply, and these brief rising tides will float most (if not all) boats when they break upon the industry’s shore.
Figure 2: All-In Module Cost Including Scale Gains, Vertically Integrated Fab, China Representative, Q4 2009-Q4 2016E
But despite all this, we hold the consensus view that the ongoing consolidation in the PV manufacturing industry will not be short-lived. We believe that the next few years (2012 to 2014) will be an extremely difficult period for most manufacturers (with some notable exceptions with regard to both periods of time and specific companies). Fundamentally, this is because of the sheer magnitude of capacity in the industry that exists in the value chain today and the speed with which feed-in tariff programs in historically vital markets in Western Europe are being ratcheted down. We are in a transitional time in the history of the PV market: the training wheels of subsidies have come off, and the next few years will represent the industry’s first, uncertain attempts to ride without support.
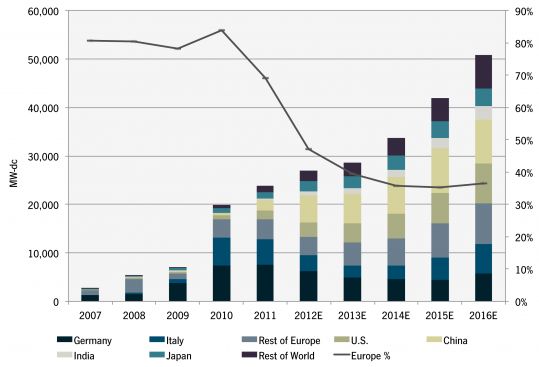
Figure 3: Annual Global PV Installations, 2007-2016E
When Will the Pain Stop?
There is another reason we have a degree of confidence in our view on consolidation this time around. Simply put, most PV manufacturers do not have a strong enough value proposition in a world where subsidies are fading fast and demand is becoming much more challenging to create. Most firms in the industry today have no place in this brave new world, and there is not much they can do to improve their competitive positioning: the die, for the next few rounds at least, was cast a long while back.
All this is well and good, but it does not tell us what we really want to know, which is: When will the pain stop? And what does consolidation look like? The answer to the first question, of course, hinges critically on the specifics of the firm in question: its business and technology model, its position in the value chain, and its competitive positioning there. Even if one is just looking at cost, different firms have very different margin profiles over the next few years, as shown in the following figure. The better positioned the firm, the shorter the current phase of the business cycle will be: for industry leaders, we estimate margins could reach the high teens as quickly as the end of 2012. The balance sheets of other, less competitive firms will be sternly tested in 2012 and 2013, but those who are left standing by then will enjoy the benefits of a more stable and consolidated world than that which exists today.
Figure 4: Blended Component Gross Margins, Selected Firms, Q4 2009-Q4 2016E
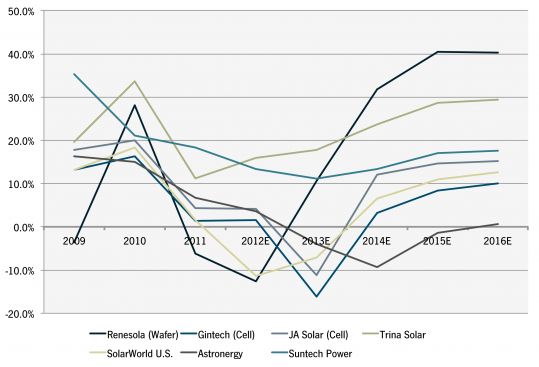
At the other end of the spectrum, some firms will never see a return to profitability, at least not as pure component producers. Such firms will have to take a long, hard look in the mirror and make tough decisions about their future role in the industry. They can either exit gracefully, or continue fighting the good fight as producers in the oversupplied ‘plain-vanilla’ component market where they have no inherent advantage, or take risks in terms of their business, technology and product models, knowing full well these moves could also end in failure. Only a few firms even have the luxury of resources to contemplate this pivot in the first place; the rest are certain to be washed away by the frequent waves of consolidation that hit the market when falling demand inevitably collides with rising inventory levels and weakened balance sheets.
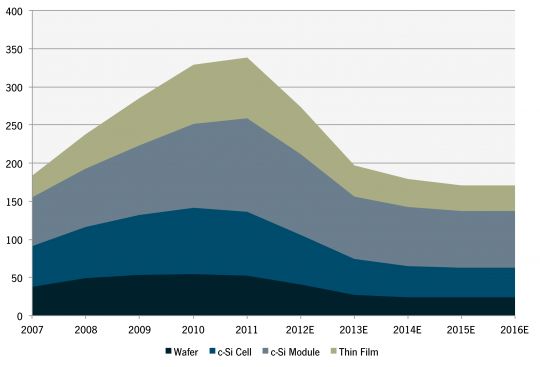
Figure 5: Number of Active PV Manufacturing Facilities, Ingot-to-Module, 2007-2016E
Mapping the Metamorphosis
Still, it is in the details that the devil lies. Given, consolidation may be the long-term trend, but what will it look like? Will consolidation occur in one fell swoop, where the industry is reduced to just a dozen or so firms over the course of a couple of years? Or will it take place more slowly, with a continuous stream of entries and exits, and a more steady departure of firms? Who will fall, and when? And what will the inflection points for dynamics in the value chain (i.e., vertical integration versus specialization), technology landscape, and business model landscape be?
To answer questions of this sort requires an analysis framework that is both granular and comprehensive. Granularity is needed in the sense of tracking competitive positioning metrics in significant detail (and therefore being able to say, for example, that China Sunergy’s wafer cost in 2012 will be higher than the market price of wafers, while Yingli’s will not). Comprehensiveness means understanding the totality of metrics that drive competitive positioning for all major players, and keeping an eye on their evolution over time. For example, Renesola might have among the lowest wafer conversion costs in the industry, but this means precious little if it cannot raise additional capital to shore up a weak balance sheet through a fiscal year that is likely to be cash-negative. Similarly, irrespective of how low Talesun’s module costs are in 2012, its penetration prospects in the U.S. remain limited on account of its low bankability. It is only with this combination of breadth and depth that one can draw insightful conclusions about the evolution of the competitive landscape, snapshots of which are shown in the following figures.
Figure 6: Efficiency/Performance-Adjusted Module Supply Stack, Q4 2013E
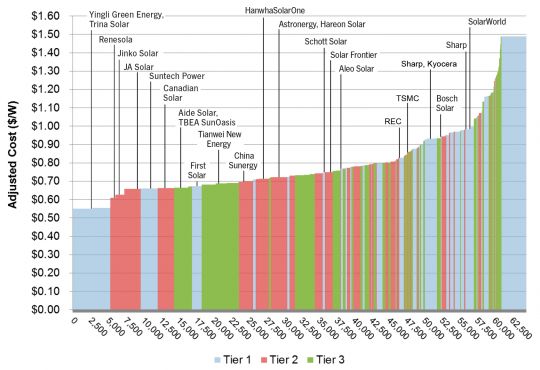
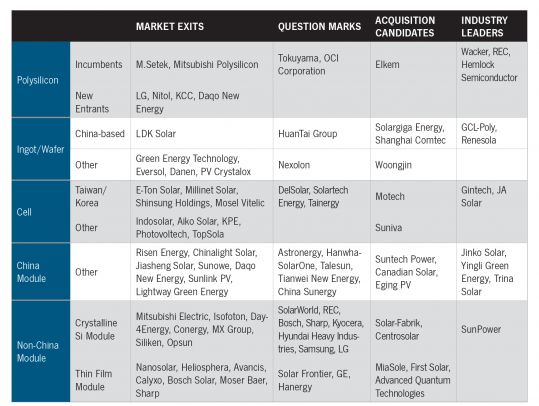
Figure 7: Evolution of Competitive Dynamics in PV Manufacturing, 2012E-2016E
Expecting the Unexpected
At the end of the day, we have still not shaken the ghost of 2009-2010. Our view of industry dynamics hinges critically on our estimate of future supply-demand balance (and therefore demand), and the supreme volatility of the PV market has made a mockery of even the most thoughtful of demand forecasts. We might even know how the story goes, but the telling of the tale does matter: for example, even if the German and Italian markets do eventually implode, who is to say that there won’t be one final hurrah in late 2012 (or even 2013) that continues to keep certain less-competitive manufacturers afloat and prices stable?
In such a market, the value of analysis must go beyond providing mere numbers. It must present their construction from the ground up, giving the reader a transparent and quantitative understanding of how the worldview articulated in these forecasts depends on key assumptions, and how sensitive the results are to them. This does not just provide value in terms of content (i.e., if demand was 15% greater than expected and capacity retirements 15% higher, industry leader module margins would be 40% instead of the predicted 18% in 2013). It also presents an analytical framework from which the reader is free to isolate elements, substitute assumptions he or she may be more comfortable using, and critique constructively for further refinement and understanding. It is our hope that the methodology and analysis presented in this report accurately reflects these requirements.


 41
41
 15
15
 9
9