
This is the third in a series on the future of energy. Part 1 is here and Part 2 is here.
***
I like data. There, I said it. Actually, I love data, so this piece will contain quite a few numbers and charts looking at how we should make the transition to a predominantly renewable energy economy here in the U.S. There are many reasons to make this transition, but I’ll take as a given that we should make this transition, focusing instead on how we can best do this.
For those who are allergic to numbers, let me sum up the conclusions here in the beginning. If we are to be successful in mitigating climate change and achieving a sustainable and independent energy system, we need to ride the waves already coming our way and do our best to start new waves where we have the power to do so.
The biggest wave by far, which is already underneath us and swelling, is solar power. We need to ride this wave as far as it will go -- and it will go far. The cost of solar power has plummeted in the last few years by more than 50 percent, and we are already seeing solar power costs at or below the cost of utility power in an increasing number of jurisdictions; this is generally known as “grid parity.” A recent report (see p. 7) found that Germany, Italy and Spain are now at grid parity for solar PV and many other countries are close.
We may as well call the point at which solar power reaches grid parity in a majority of jurisdictions around the world the “solar singularity.” When this moment is reached, solar power will take off and become the dominant power source relatively quickly. My feeling is that we’ll see solar reach half or more of our power supply in the U.S. sometime in the 2030s. That’s still a ways off, but pretty soon in terms of energy transitions.
I argued recently that we are already effectively at the halfway point to solar ubiquity because we reached 1 percent of new power plant installations from solar in 2013. As strange as it sounds at first blush, 1 percent is halfway in terms of the doublings required to get from nothing to 1 percent and from 1 percent to 100 percent. So in terms of the time required, we may indeed be halfway to solar dominance. This is an example of Kurzweil’s law of accelerating returns. Time will tell if I’m right.
The next big wave is energy storage. It’s nowhere near as certain as the solar wave, and its swell is now only barely perceptible. But with the right policy support and an army of smart entrepreneurs, this energy storage wave will be just as rideable as the solar wave. Germany is leading the way (again) on installations, with more than 4,000 residential PV-plus-battery systems installed in the first year of a new storage rebate program. California is arguably leading the way on the utility-scale side. Energy storage will be key for integrating variable renewables like solar and wind into our grids as penetration reaches high levels (we won’t need it for a number of years, but by planning now for when we do need it, we will make the transition that much smoother).
Energy storage is more useful for the grid than natural-gas backup power because energy storage devices can go both ways: they can absorb and dispatch power to the grid, whereas natural-gas plants can only dispatch. So it’s two for the price of one when it comes to energy storage. The price, however, is the catch for now: even though research suggests that energy storage may already be cost-effective when we properly account for the benefits to the grid, most observers would agree that there’s still a lot of room for energy storage costs to come down. My feeling, admittedly tinged with optimism, is that we’ll see the same trend in the energy storage business that we’ve seen in solar in the last five years, with strong demand prompting a huge ramp in production and thus big drops in price.
The last wave I’ll mention here is the energy efficiency wave. We use energy very wastefully because, frankly, energy is still really cheap. In the U.S., we waste well over half of all the energy that is actually available in our system (see Figure 1). And when we consider the potential for conservation and behavior change to reduce energy use even further, we could, it seems, be just as productive as we are today on an energy budget that is approximately half of what we currently use.
For the western half of the U.S., a grid consisting of large amounts of solar, wind, hydro and biomass that is backed up with energy storage and flexible natural-gas plants could readily provide all or a large part of the power we need to maintain and grow a modern economy. Other parts of the U.S., particularly the South, don’t have quite the renewable energy endowment that the Western U.S. has, or even the Northeast. However, high-voltage DC power lines are an option for areas without an abundance of renewable energy. While distributed energy and localized grids are to be preferred, I’d rather see renewables supply the South via power lines from Texas and the Midwest, or from large offshore wind farms in the Atlantic, than see the South continue with its coal-dominated power mix in perpetuity.
Now for some numbers
Ok, let’s talk numbers. I’m going to describe a plausible pathway for the U.S. to become a predominantly renewable energy economy by 2035 to 2040. I stress “plausible” because, of course, this kind of forecasting is generally an exercise in futility due to so many unpredictable variables. But that shouldn’t stop us from trying. I’ll describe what the U.S. currently uses for electricity, transportation and other types of energy today and then project forward to 2040. Then I’m going to show in broad terms how we could reasonably make the transition to a predominantly renewable energy system by 2040.
I’m going to use “quads” as my common unit, which is short for a quadrillion British thermal units (Btu). Quads are commonly used when talking about large-scale energy use, such as in the context of an entire nation's energy budget. For example, the U.S. used about 97 quads of energy in 2013 (see Figure 1).
FIGURE 1: U.S. Energy Flow Chart, 2013
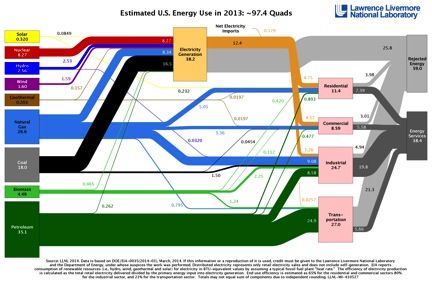
Source: Lawrence Livermore National Laboratory
We can follow Figure 1 and group the various end uses of energy into four sectors, which we’ll tackle below: 1) transportation; 2) industrial; 3) commercial; and 4) residential.
We see from this same chart that petroleum is the single largest energy source in the U.S., followed by natural gas and then coal. Renewable energy is still a relatively tiny share of the whole, even if we include large hydro, which isn’t even considered renewable in some jurisdictions, like California, due to its environmentally-damaging impact.
Another major takeaway from this chart is the pronounced inefficiency in our energy use. A total of 59 quads is “rejected,” that is, wasted. Only 38.4 quads are used productively. This poses a big opportunity to use energy more efficiently.
Looking ahead, the Energy Information Administration projects a 30 percent increase in vehicle-miles traveled by 2040, according to the EIA Annual Energy Outlook 2014. However, projected increases in fuel economy more than offset this increase in driving, and the net result in EIA’s forecast is actually a decline in transportation fuel demand by 2040, falling from 26.7 quads in 2012 to 25.5 in 2040.
In its reference case, the EIA projects that electricity consumption will grow 0.9 percent per year through 2040 and that natural-gas consumption grows by about 0.8 percent per year through 2040, with industrial use of natural gas in chemical production showing the strongest growth.
In sum, EIA expects U.S. energy consumption to increase to about 106 quads by 2040, from 97 quads in 2013, an increase of 9 percent.
I’m going to define a “predominantly renewable energy economy” as one with 80 percent or more renewable energy, which includes renewable electricity, biogas and biofuels. No, it doesn’t include nuclear. This makes the magic number to reach by 2040 or sooner about 85 quads (80 percent of 106 quads).
So how do we get to 85 quads from renewables?
Price-induced conservation and energy efficiency
First, I disagree with EIA about the likely trajectory of U.S. petroleum demand. Based on the arguments I set forth in Part 1 of this series, I believe there is a very good case for lower U.S. oil production than the EIA projects in the longer term. This will lead to higher prices and a significantly lower energy content of produced barrels, because unconventional oils contain less energy per barrel than conventional oil. The main points I made in Part 1 concerned 1) much higher than normal decline rates for unconventional oil wells; 2) the apparent failure to consider the lower energy content of unconventional oil, which reduces the available energy EIA projects by as much as 30 percent; and 3) the failure to consider the global impact of dramatically declining net oil exports as major oil exporters use ever larger portions of oil that they produce while their oil production declines over time.
The EIA already includes in its forecasts an increasingly efficient economy, because this has been the long-term trend. EIA projects a 2 percent decline in energy intensity per year through 2040. This means that our economy will produce the same goods and services each year with 2 percent less energy.
FIGURE 2: EIA’s Energy Intensity Projections
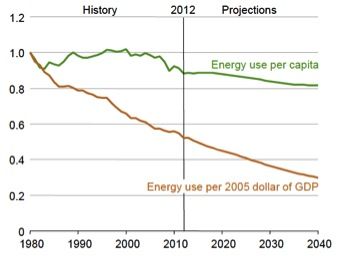
Source: EIA AEO 2014
However, due to the factors mentioned above, it seems likely to me that we’re going to see substantially more price-induced energy conservation than the EIA projects by 2040. Moreover, as we shift to electricity as a major transportation fuel, a large increase in efficiency is achieved because electric vehicles are two to three times more efficient than conventional cars in converting energy into motion. Accordingly, I’m going to assume that 25 percent of the 85 quads will be met by additional conservation and efficiency that is not included in EIA’s current forecast. This brings us to 64 quads as the magic number to achieve by 2040.
Transportation energy
Let’s start with the hard part first. Shifting to a predominantly renewable electricity system seems almost inevitable at this point. The transportation sector is a tougher nut to crack because we’re still so dependent on petroleum. Electrification is the key, however, to weaning us from petroleum, as well as from coal and natural gas. There are a ton of other ways to reduce petroleum demand -- hybrid cars, smaller and more efficient cars, biking, walking more, carpooling, increasing busing and train routes, smarter urban planning, etc. -- but to actually get us off petroleum, we should look primarily to the electrification of vehicles. I won’t rehash the arguments here, but I covered the debate over electric vehicles vs. fuel cell vehicles here. In sum, I don’t see fuel cell vehicles as a significant player in our future.
EIA, as mentioned, projects 25.5 quads will be needed for transportation energy by 2040, but this forecast includes only a small amount of electrification. Based on the logic described above, to account for increased price-induced conservation and improved efficiency, I reduce this figure by 25 percent to 19.1 quads. This means that higher petroleum prices will induce a stronger shift away from traditional vehicles, and away from driving more generally, than EIA currently projects.
While biofuels like ethanol and biodiesel are far from perfect solutions, we can’t ignore that they have in fact grown rapidly in recent years and are probably here to stay. Ethanol now provides about 1 million barrels of fuel per day in the U.S., which, after adjusting for energy content, is equivalent to about 700,000 barrels per day of oil, or about 3.7 percent of U.S. consumption. Assuming only that biofuels production stays constant, subtracting this amount from 19.1 results in a total of 18.4 quads needed for transportation energy by 2040.
Since I’ve defined a renewable energy economy as one that gets 80 percent or more of its power from renewables, we can reduce this 18.4 quads to 14.7 quads, which assumes that 20 percent of transportation will still come from fossil fuels by 2040. Since this column is an outline, I’m going to forecast at this point that this 14.7 quads will come entirely from electricity due to relatively rapid electrification of transportation through various types of electric vehicles. This point is, of course, highly debatable and uncertain, but, again, I think it’s plausible, given the trends we’re seeing today. We have 26 years to get there.
The astounding thing about electric vehicles is that they use energy about three times more efficiently than internal combustion engine vehicles. So switching our fleet to EVs entirely by 2040 would allow us to meet all 80 percent of our transportation needs with only about 5 quads of electricity. (If you don’t believe me, feel free to double-check my math.)
Electrifying our transportation sector also allows us to focus on how we produce electricity in our country as the key task for transitioning off fossil fuels economy-wide, which we discuss next.
Our renewable energy future
We currently produce most of our electricity from coal, but an increasing share comes from natural gas and renewables. Nuclear power’s share is significant but slowly shrinking. In 2013, the EIA stated that the U.S. obtained 41 percent electricity from coal (down from more than 50 percent just a few years ago), 26 percent from natural gas, 19 percent from nuclear, 13 percent from renewables (which includes large hydro), and 1 percent from petroleum.
FIGURE 3: Sources of U.S. Electricity Production (Trillion Kilowatt-Hours)
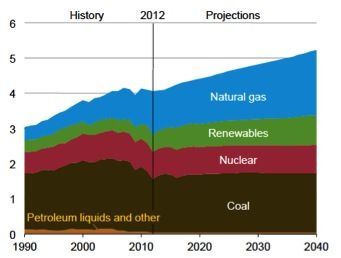
Source: EIA AEO, 2014
By 2040, the EIA projects that the mix will change to 32 percent coal, 35 percent natural gas, and 16 percent each for nuclear and renewables. I think these projections are way off, due largely to the within-reach “solar singularity.”
EIA has often been wrong when it comes to projecting both renewable energy growth and fossil fuel production. In the case of renewables, the agency has almost always been too pessimistic (here’s a study of the International Energy Agency’s projections, which generally closely mirror the EIA’s projections and vice versa). In the case of fossil fuels, however, the EIA is generally too optimistic. (The last few years have shifted EIA’s record on fossil fuels because the shale gas and oil revolutions have surprised almost everyone.)
Converting the EIA’s numbers into quads, we arrive at a revised forecast of 12.6 quads of electricity consumption in the U.S. by 2040, which includes my standard 25 percent reduction due to additional price-induced conservation and efficiency. Reducing that figure by 20 percent (allowing for our 80 percent definition of a “predominantly renewable energy economy”) brings it down to 10 quads. But we need to add in our shifted transportation electricity demand (5 quads), and this brings our total renewable electricity goal to 15 quads.
I’m going to be bold and project, based on today’s growth rates of solar and the almost-here grid parity for solar around the country, that we’ll see solar grow to 50 percent of all electricity supply by 2035-2040, including our shifted transportation energy demand. This isn’t just a wild guess. It’s based on a projected growth rate of 30 percent per year from 2013 onward.
Actually, 30 percent is a significantly lower growth rate than we’ve seen in the last five years (a period with an average 54 percent growth rate in solar electricity produced), but we should expect the rate to slow down over time, since this is an almost universal pattern for the diffusion of new technology.
The 30 percent growth figure is admittedly a guess, but it’s an educated guess based on the many positive trends in the solar industry and the fact that solar is so scalable and modular. Some areas of Australia have reached 25 percent or higher residential penetration rates for solar in just a few years -- the highest in the world -- and there’s no reason to think that we can’t achieve similarly fast penetration in the U.S. once the tipping point has been reached. The U.S. only has about 0.3 percent of solar penetration in 2014, but with steady growth rates, this small base grows rapidly, spurred by low cost and massive scalability.
Wind power growth is less certain, for a variety of reasons, including the fact that wind resources aren't as widely available as solar resources, as well as the additional permitting hurdles that exist for wind turbines as opposed to flat solar panels. Also, the annual growth rate of wind in recent years has been highly variable. Average growth for wind power in the U.S. over the last five years has been 25 percent. If we project only half that annual growth from 2013 onward (12.5 percent), we get to about 10 quads of wind power by the late 2030s. This leaves some wiggle room, as with solar, for lower growth rates to still meet the projections for 80 percent renewables.
So under these projected growth rates, wind and solar could bring us to about 80 percent of all electricity consumed by 2035 to 2040, leaving 20 percent to be provided by other renewables and/or natural gas and storage, and possibly some remaining nuclear plants. The 15 quads of total electricity demand by 2040, including the shifted transportation energy, could, then, come from wind and solar backed up with battery storage, baseload renewables and residual conventional power sources.
Biomass and geothermal are important renewable energy technologies, particularly because they’re generally baseload sources, that is, they can produce power when needed. Biomass, geothermal and small hydro could probably provide the 20 percent of remaining electricity needs by 2040, which would allow elimination of all fossil fuels in the electricity sector. Additional incentives will likely be needed for these technologies because they’re currently not growing very fast, for a variety of reasons. Given the technical potential for these resources, however, and given the many examples around the world of how smart incentives can help bring new technologies to scale, there is a strong argument to be made in favor of providing additional incentives for these baseload renewables.
Will we really eliminate fossil fuels in electricity generation by 2040? Almost certainly not. But that’s not my point here. My point is to show that we could if we decide we want to, based on plausible growth rates for renewables.
Maintaining grid reliability
Grid reliability is a major issue when it comes to high penetration of renewables. As discussed briefly in my introduction, we will need large amounts of energy storage to balance a predominantly renewable energy grid. For present purposes, I’m simply going to assume that the nascent energy storage wave I discussed above swells fast enough to allow integration of renewables at the levels I project in this article. This is a very big assumption, and time will tell if I’m way off. Keep in mind, however, that I have allowed 20 percent of electricity to come from non-renewable sources in my definition of a renewable energy economy, and this allows some padding to help balance a high-renewables grid, along with lots of energy storage and interconnected grids for further balancing.
Substituting for natural gas
So far we’ve covered petroleum and electricity. This covers the lion’s share of energy use in the four energy consumption sectors of industrial, commercial, residential and transportation energy. It leaves out, however, heating, cooling, and industrial use of natural gas. EIA calculates about 20.8 quads of natural gas use for heating, cooling and industrial processes by 2040. Reducing by 20 percent due to our definition of “predominantly renewable,” we get 16.6 quads that we need to source from additional renewables to get to our goal.
Solar PV’s poor cousin is solar water heating technology. In fact, solar water heating may be more prevalent in the world today than solar PV; it’s just not as sexy. China's solar water heating rivals the rest of the world’s installed PV capacity, with about 118 gigawatts equivalent of solar thermal installed in China by 2010 and significant growth since then.
Solar water heating is growing in the U.S., but not as fast as solar PV. California has had a rebate program for solar water heating for a number of years, but it’s still a relatively small program. A 2007 NREL study found only 0.5 quads of technical potential for SWH in the US. This leaves 16.1 quads to make up. This is a tough sector to source predominantly from renewables, but for present purposes, I’m going to project that a mix of SWH, biomass and renewable electricity can meet these 16.1 quads. This will require a higher growth rate for renewable electricity sources than I have projected above, so it may be the case that natural gas for industrial processes and heating and cooling will take a bit longer to source predominantly from renewables than transportation and electricity.
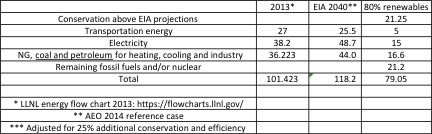
Summary
Here’s a summary of my projected path to 80% renewables (units are quads).
Mark Jacobson and his team at Stanford have completed a huge amount of work in this area. Their draft 2014 paper looking at achieving a 100 percent renewable energy economy by 2050 provides strong support for my projections here, though they don’t see things changing quite as quickly as I do.
Jacobson’s work has been incorporated into a very useful website with nice infographics showing how each state can achieve the transition. Here’s the graphic for California, showing about 50 percent solar and about 35 percent wind by 2050, which includes a 44 percent improvement in energy efficiency.
The National Renewable Energy Laboratory also completed a major study in 2012 looking at what it would take to get to 80 percent renewable electricity by 2050 in the U.S. NREL projects that wind will be the largest single source of electricity, and it also shows a higher percentage of biomass than I’ve calculated here.
I haven’t discussed costs at all. However, it is clear already that transitioning to a fully renewable economy will save tons of money on a net basis. This is counterintuitive to most. Aren’t renewables more expensive? Well, historically they often have been, but that’s changed a lot, and the costs of renewables continue to fall while the costs of fossil fuels generally continue to climb. This means that after the costs of installation and maintenance are accounted for, the savings from zero fuel costs (for most renewables) and a far more efficient economy more than outweigh the initial costs. Jacobson has crunched the numbers, and he and his team project a net savings of $4,500 per year per person in the U.S. When you factor in health benefits from far less pollution, the savings almost double.
Another study from the International Energy Agency projected a net savings of $71 trillion (yes, with a “t”) by 2050 resulting from the investments in new energy technologies required to keep the globe’s temperature from rising more than 2 degrees Celsius. Again, these cost savings result primarily from fuel cost reductions.
We have, then, a number of very compelling arguments that we should shift to a renewable economy, even absent any climate or energy independence benefits: we could and should do it entirely as an economic boost.
Final thoughts
It is worth reminding readers that the scenario I’ve sketched should be considered a high petroleum price scenario, based on the factors I’ve outlined above that relate to global oil production, net exports and net energy content. As such, if for whatever reason oil prices remain at or below current levels, it’s very likely that my projections will be off.
***
Tam Hunt is the owner of Community Renewable Solutions LLC, a renewable energy project development and policy advocacy firm based in Santa Barbara, California and Hilo, Hawaii.


 41
41
 15
15
 9
9