
Photovoltaic system costs have been dropping. In fact, as has been highly publicized, solar panel prices have more than halved since 2009. For developers and electricity purchasers, this is welcome news. Declining system costs should help solar projects compete with other types of power – something that has happened infrequently in the U.S. However, many in the solar industry appear to extrapolate from recent trends that solar project costs only will continue to decline in the future. In anticipation of this brighter future, some industry participants are tempted to adjust PPA prices downward (many “winning” PPA prices are now in the $0.10/kWh range) or to delay constructing projects so as to hold out for higher returns. While we at PowerFin share in the excitement surrounding the currently low system costs, and while we are hopeful about cost declines in the future, we caution against overzealous PPA pricing or delaying project construction based upon inferences drawn from the current industry cycle.
From PowerFin’s perspective, speculation that solar PPA power prices only will decline hinges on two dangerous assumptions: (1) that further meaningful declines in system costs still are possible, and (2) that the cost of capital for solar projects will remain at current levels or decrease. Although we believe that there is room for debate regarding how much system costs will come down in the coming years, this article focuses on the second assumption – that interest rates will remain flat or decrease.
To begin, the cost of capital can have a much greater impact on solar project value than system costs. Simply put and very generally speaking, a 1% increase in the cost of capital would require the same project, with the same PPA, to be valued for roughly $0.50/Watt less! That is more than a 10% drop in total asset value. What portion of system costs should be cut to recapture that $0.50/Watt reduction in value? Panel prices? Developer fees?
Using a dividend discount model, where System Value = Annual Cash Flow / (Cost of Capital – Growth Rate), a system generating $0.19/Watt of annual cash flow with a cost of capital of 6% and a negative growth rate of 0.7% (panel degradation), implies a system value of roughly $2.80/Watt. Dividing that $2.80/Watt by 70% (1 – 30% Grant or ITC), we arrive at a gross system value of $4.05/Watt. Using the same assumptions and only changing the cost of capital to 7%, implies a system value of $2.47/Watt. Dividing that $2.47/Watt by 70% implies a new system value of $3.53/Watt, or a $0.52/Watt reduction in value. Given the long-lived and stable nature of solar generating assets, we believe that the dividend discount model is an appropriate, albeit simple, valuation tool.
There are two primary factors that contribute to the cost of capital (mostly debt) for solar projects: (1) long-term treasury rates, and (2) the premium (spread) that must be paid above treasury rates. Assuming a 20-year treasury rate of 3%, and assuming a project-specific spread of 3%, the total cost of capital is 6%. Of course, there are other elements that impact debt pricing (e.g. – coverage ratios, duration, and underwriting costs, etc..), but those are variables that tend to be sponsor-specific and lender-specific; thus, they are beyond the scope of this article.
We think that many market participants overlook treasury rates as a factor that contributes to the cost of solar projects. As shown in the charts below, 10-year and 30-year treasury rates are at historically low levels. At PowerFin, we are not macroeconomists; but, based on these charts – and based on our experience with the cyclicality of capital markets – it appears that treasury rates most likely will increase in the future. Granted, there are financial instruments, such as fixed-for-floating treasury swaps, that can alleviate treasury risk, but it is likely not possible for most developers to assume the risk of such an instrument. Therefore, we believe that most developers who lower their PPA prices or delay construction in anticipation of further declines in system costs fail to fully appreciate the risk of treasury rate increases.
It could be argued that spreads (premiums above treasury rates) for solar projects should compress as the capital markets come to understand solar projects better. We do not disagree. However, we want to be realistic about the availability of money for solar projects, about the fact that most institutional lenders are unwilling to provide loans smaller than $20 million or for projects smaller than 10MW (10MW x $4.00/Watt x [1 - 30% Grant or ITC] x 80% Debt/Capital), and about the fact that those who are willing to lend smaller amounts or into smaller projects certainly charge more than a 3% premium over risk-free treasuries. U.S. solar project finance, with its tax-based incentives, is complex. That complexity has hindered U.S. solar market growth and subsequently has impaired investor familiarity with the sector, which is necessary for yield spread compression. We believe that growth will remain slow as the capital markets come to terms with the complexities of solar finance. Therefore, even if system costs continue to decline over the next several years, interest rate increases easily could make most solar projects with aggressive assumptions unbankable.
We believe that the best way to accelerate spread compression and to mitigate treasury rate risk is by completing current projects quickly. It takes fewer than six months to construct a solar project of less than 50MW, and the industry must not wait for system costs to decline further or for the cost of capital to fall before completing projects. Developers and off-takers should not base PPA pricing solely on the expectation of further system cost declines. We think that the current pricing environment for systems and capital is quite attractive, and we believe that developers and off-takers should expedite project completion – now.
PowerFin Partners is a manager of institutional funds for solar projects in North America. Its principals have meaningful experience in energy capital markets, legal and regulatory matters, and renewable engineering.
10-Year US Treasury Rates (1962 – Present)
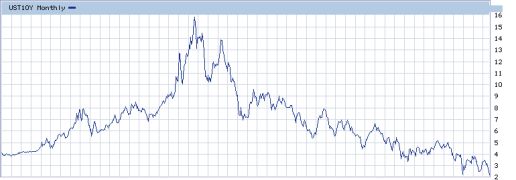
Source: The Wall Street Journal
30-Year US Treasury Rates (1985 – Present)
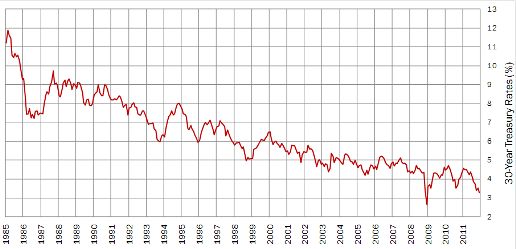
Source: Bloomberg


 41
41
 15
15
 9
9