
The following is an analyst note from GTM Research.
The Supreme Court ruled in favor of interstate wholesale markets for demand response in the case of Federal Energy Regulatory Commission (FERC) vs. Electric Power Supply Association.
Since May 2014, the industry has been dealing with the issue of jurisdiction and compensation for demand response (DR). The former issue deals with FERC’s authority over demand response participation in wholesale markets, while the latter pertains to whether demand response has the same value as supply resources.
As a result of the recent ruling, FERC continues to have the authority to regulate demand response in U.S. wholesale energy markets, in addition to allowing demand response to be compensated via the locational marginal price (LMP). This is a landmark decision for demand response as a market resource, which now captures an estimated $2 billion worldwide in market revenues, approximately 85 percent of which is earned in the U.S. GTM Research valued the U.S. demand response market at $1.4 billion in 2015.
Demand response in domestic wholesale markets
The potential and contribution of demand response is not equal in all regions of the U.S. However, the increasing number of megawatts under management over the years has made the resource critical to providing valuable market liquidity and peak demand reductions.
In 2015, there was over 28,000 megawatts of potential peak reduction available -- equivalent to more than 6 percent of the peak demand in the U.S. The majority of these resources operate within only a few markets, of which PJM is the largest, representing over 30 percent of the total potential DR capacity in the U.S.
There are various markets for demand response in PJM, including emergency and economic DR programs that can participate in the energy market (day-ahead and real-time), the ancillary services market (regulation and synchronous reserves), and the reliability pricing model (RPM) capacity market. As of December 2015, PJM had an estimated 12,910-megawatt potential demand reduction from all three markets, yielding a total revenue of nearly $750 million.
FIGURE: 2015 DR Revenue by Market in PJM
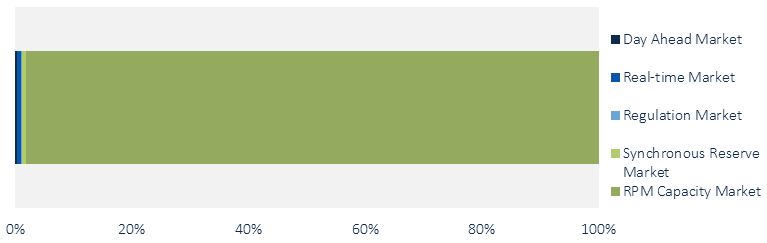
Source: PJM, GTM Research
The implications of the court’s decision
The capacity market accounts for over 90 percent of DR revenue in PJM. The Supreme Court decision, which centers on much smaller energy markets (i.e., the day-ahead and real-time markets shown in Figure 1 above), is still crucial to future participation of demand response as a resource in the capacity market. The critical issue was FERC jurisdiction over demand response, as seen in the following three potential outcomes of the case.
- FERC is awarded jurisdiction over DR regulation for participation in domestic wholesale energy markets, and DR compensation is awarded at the LMP.
- FERC is awarded jurisdiction over DR regulation for participation in domestic wholesale energy markets, but DR loses the full LMP compensation.
- FERC has no jurisdiction over DR participation in U.S. wholesale energy markets and DR therefore does not get LMP compensation.
In scenarios 1 and 2, FERC retains authority to regulate regional markets, which permits DR to continue to participate in capacity markets. However, if FERC had been denied jurisdiction (scenario 3), DR participation in capacity markets would have had to be determined separately in legal proceedings down the line, saddling the industry with significant uncertainty.
GTM Research expects the Supreme Court decision, which allows for both FERC jurisdiction and remuneration of DR via LMP, to put the DR market back on a path of strong growth -- yielding up to a $200 million increase in market size by the end of 2016.
The impact on DR providers
To examine the impact on DR providers, we will use EnerNOC as an example. While it’s true that EnerNOC participates in the U.S. wholesale energy markets directly subject to the decision, that observation reflects only one facet of the company's situation.
EnerNOC earns revenue from three sources: wholesale energy markets, distribution and retail utilities, and commercial and industrial end users. The following chart shows what proportion of EnerNOC’s overall revenue has come from the three sources in each quarter since 2014.
FIGURE: EnerNOC Quarterly Revenues by Source Since 2014
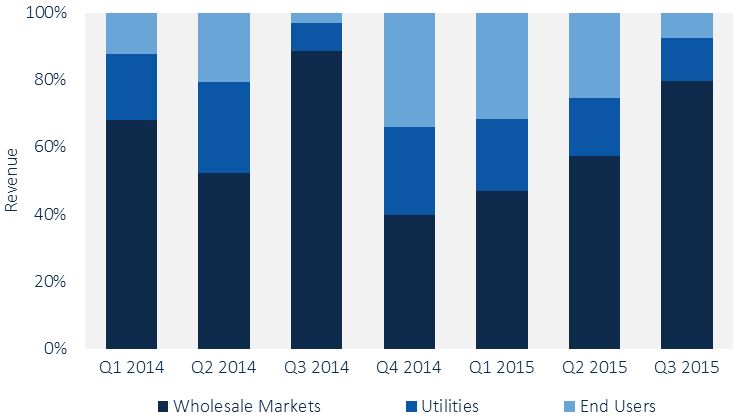
Source: EnerNOC
Although EnerNOC participates in wholesale markets, the company has diversified its lines of business. The same holds true for many other providers. To make demand response feasible, providers like CPower, Johnson Controls, IPKeys and Rodan develop deep relationships with customers to determine which energy-consuming activities are best suited for a demand-response program. This relationship opens the door for upsell opportunities for software and services to improve energy procurement, measurement and management.
As it turns out, the energy management software that EnerNOC offers directly to end users and through utility channels is the company’s fastest-growing business segment (a fact that EnerNOC highlighted in its most recent earnings call, and plans to further emphasize when it splits its revenue reporting into “DR Resource” and “Software” segments in 2016).
Now let’s turn back to wholesale market revenues. A full three-quarters of EnerNOC’s revenue from Q1 2014 to Q3 2015 came from wholesale markets. Over the last few years, this segment has become much more geographically diversified. The company currently participates in 14 wholesale markets around the world -- only five of which are currently overseen by FERC. In line with our earlier revenue distinction between energy market and capacity market revenues, we can estimate that domestic energy market revenues accounted for perhaps a maximum of 6 percent of EnerNOC’s overall revenues over this period.
FIGURE: Representative Breakout of EnerNOC Revenues, 2014-Q3 2015 (Estimated)
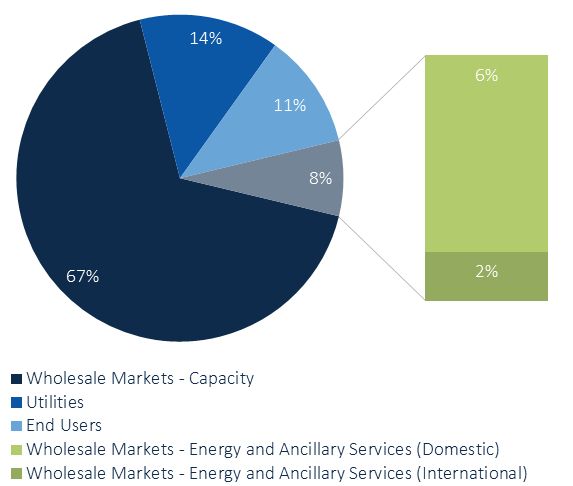
Note: The percentages shown are not exact figures; rather, they are estimated using market revenue averages of a 9:1 split of capacity revenues to energy and ancillary services market revenues across all geographic markets, and an 8:2 split of domestic to international energy and ancillary services market revenues.
Source: GTM Research
All of this is not to say that EnerNOC would have emerged unscathed in the event of an adverse decision in the Supreme Court case. As we point out above, there was a significant risk that the question over FERC’s jurisdiction in the energy market would have had implications for FERC’s jurisdiction in the capacity market -- and thus would greatly impact the largest slice of the revenue pie shown above. But for a DR provider like EnerNOC that earns revenue from multiple sources across a wide geography, the recent ruling will have a measurable yet limited impact on revenue going forward.
Closing thoughts
The Supreme Court acknowledges that matching supply and demand has evolved into a competitive interstate business and that FERC’s role needs to evolve accordingly. In the words of the court:
“Decades ago, state or local utilities controlled their own power plants, transmission lines, and delivery systems, operating as vertically integrated monopolies in confined geographic areas. That is no longer so. Independent power plants now abound, and almost all electricity flows not through 'the local power networks of the past,' but instead through an interconnected 'grid' of near-nationwide scope. [...] In this new world, FERC often forgoes the cost-based rate setting traditionally used to prevent monopolistic pricing.”
***
Elta Kolo and Andrew Mulherkar are Grid Edge Analysts at GTM Research working on demand-side management in U.S. electricity markets.


 41
41
 15
15
 9
9