
The last half-decade or so has seen the PV industry limited by the availability of feedstock (i.e., polysilicon) and manufacturing capacity. After a near doubling of global installations in 2008, 2009 is expected to see a substantial imbalance between available supply and demand, with the numbers tilted heavily in favor of the former. As discussed in April’s edition of PVNews, by the end of 2009, year-end cell capacity will stand at a staggering 17.6 gigawatts. When taking into account production and capacity ramp rates, this is enough to produce almost 14 gigawatts of modules. By contrast, we estimate demand for 2009 to be only 5.5 gigawatts.
In the face of overcapacity of such proportions, it is obvious that only a small portion of available capacity will be utilized. Put another way, there will be a significant amount of potential production that does not make it under the market-clearing price – the price at which supply equals demand. The first order of business, then, is to identify what supply “gets through” (whose capacity actually gets utilized) versus what “gets left behind.”
As we discussed in PV Technology, Production and Cost, 2009 Forecast, we built global supply stacks for PV modules from the ground-up – company by company, technology by technology, year by year, and we reconciled these with demand curves in 2009 Global PV Demand Analysis and Forecast to obtain equilibrium volumes and clearing prices. Figure 1 displays such a reconciliation for 2009.
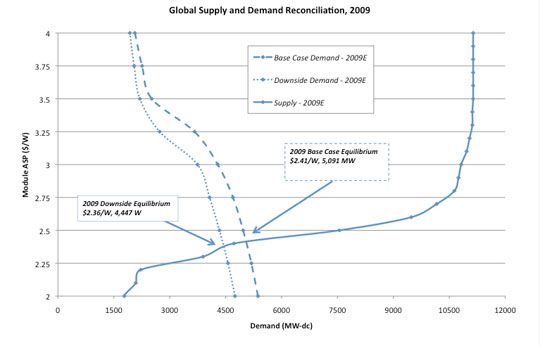
Once you see where demand and supply intersect, it actually becomes possible to identify winners and losers, based on their proximity (or lack thereof) to the clearing price. Our approach here was to divide the supply stack into three brackets or “tiers” of supply, utilizing the French concept of Triage (as if PV wasn’t already sexy enough on its own) for sorting the wounded on a battlefield. Essentially the triage system entails classifying victims into three categories:
1. Those likely to live, regardless of whether they receive care;
2. Those likely to die, regardless of whether they receive care;
3. Those for whom immediate care might make a positive difference in outcome.
When mapped to producible PV supply, the three tiers correspond to the following characterizations:
1. Those who are likely to survive under their own devices (Tier 1, those whose fully loaded costs on an efficiency-normalized basis are 15 percent or more below the equilibrium price);
2. Those who are distressed to point of few prospects of aid (Tier 3, costs 15 percent or more above equilibrium);
3. Those who may survive through a combination of rapid attention and a dose of providence (Tier 2, within +/-15 percent of equilibrium).
Tier 1: In the Clear
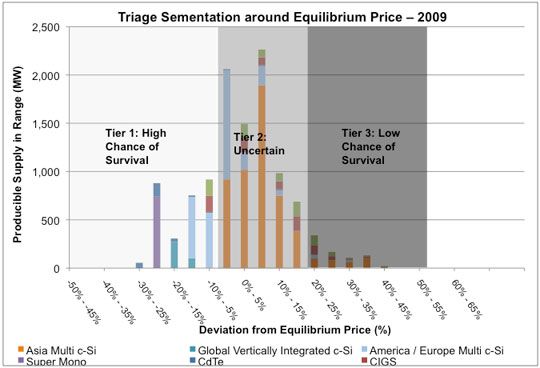
Figure 2 displays potential (or producible) module supply in 2009 by location and technology, segmented into the three tiers. Tier 1 is dominated by supply from CdTe (First Solar), large-scale European wafer-to-module multicrystalline producers (Solon) and “super mono”, i.e., high-efficiency monocrystalline producers (Sunpower, Sanyo), with notable contributions from large-scale amorphous silicon producers (Sharp) and vertically integrated multicrystalline producers (REC, Solarworld) as well. The largest-scale firms utilizing these technologies will have the most competitive economic offerings and should not have problems in selling their modules into even a demand-constrained market.
Tier 2: Uncertain Prospects, and a Struggle to Survive
Tier 2 supply consists largely of large-scale multicrystalline and amorphous silicon supply (with small amounts of low-scale CdTe and CIGS producers). Competition here is fierce, with the overwhelming majority of the producible supply (60 percent to 70 percent) being concentrated in this bracket. American and European wafer-to-module producers and global vertically integrated producers start out with their nose in front thanks to lower polysilicon prices, but this is expected to change: as blended prices for European and Asian producers converge, the lower labor costs and higher manufacturing scale for Asian producers will result in a lower cost structure by 2011 and 2012.
Given that they are so close to the equilibrium price, the fate of producers in this middle tier is uncertain and subject to a number of factors. To the extent a rising tide floats all boats – that is, demand is better than expected on account of improved macro-economic conditions or heretofore unexpected policy actions – firms at high manufacturing scale and that have an edge over their peers when it comes to company-specific factors such as operational performance, customer relationships, balance sheet strength, brand recognition, and contracted polysilicon position could survive, or better still, succeed. On the other hand, in a world where demand is worse than predicted by our base case, firms in this bracket could struggle to survive, and a number would be forced to sell their modules into the market at or below cost to push volumes through. Indeed, we have seen evidence to suggest that this has already begun, with lower-bracket Chinese manufacturers ready to sell their modules for as low as $2.00 per watt.
Tier 3: Victims of the Shakeout
Tier 3 supply consists of firms whose cost structure is 15 percent above the equilibrium price or worse. For the most part, it comprises of the same location/technology buckets as Tier 2 – i.e., multi c-Si producers and amorphous silicon producers. This bracket consists mostly of supply from smaller European multicrystalline firms and amorphous silicon producers who have not scaled up sufficiently to achieve competitive cost structures.
To state the case bluntly, the most likely outcome in practice is that many of these firms will not survive in a demand-constrained world. To the extent they have assets that can be incorporated into larger competitors, they will be absorbed. To the extent that the capital assets are not valuable, they will be re-purposed or scrapped. As the mortally wounded are left for dead, what will likely emerge over the next few years is a substantially smaller list of superior companies with relatively higher concentrations.


 41
41
 15
15
 9
9