As the solar PV supply market continues to mature, the market's focus is expanding beyond the module and onto reducing the costs associated with PV balance-of-system (BOS) components. This includes all non-module components (inverters, mounting structures, etc.), along with the “soft” costs (permitting, labor, EPC margins) associated with project development and construction.
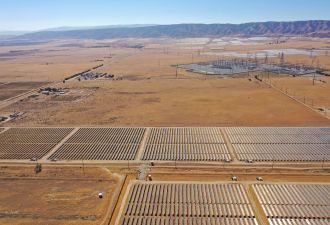
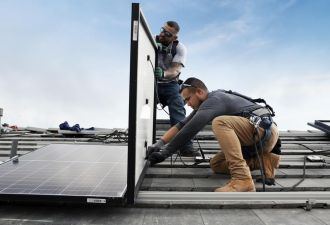
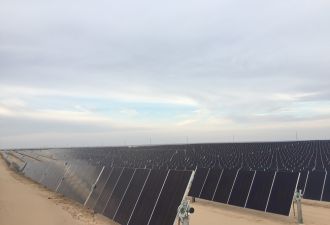
At the same time, the ground-mounted system market is experiencing unprecedented growth, as PV demand decentralizes and migrates away from Europe -- where rooftop systems represented 85% of more than 14.6 GW of total installations in 2010 -- to markets such as the United States and China that are developing a greater forecasted share (40% to 45%) of ground-mounted PV projects. This global shift toward the ground-mounted system will inevitably place the economics of both fixed and tracking structures under further scrutiny as developers and EPCs battle over every cent of cost reduction.
According to the recent GTM Research report, Solar PV Balance-of-System: Technologies and Markets, BOS components for ground-mounted systems currently comprise roughly 45% of total PV project costs, with that percentage forecasted to rise to nearly 51% by 2012, marking the first time BOS costs will surpass those of the module for a typical, utility-scale crystalline silicon (c-Si) project.
The figure below provides a snapshot into the current average cost breakdown for ground-mounted BOS components in a thin film project (using CdTe as an example) with 11.5% module efficiency and a multi c-Si project with 14.4% efficiency. As can be seen, the largest cost component is the mounting structure, followed by labor and the inverter.
FIGURE: BOS Cost Comparison, c-Si vs. CdTe (2010)

Source: Solar PV Balance-of-System: Technologies and Markets
Over the next few years, we anticipate BOS costs to fall meaningfully due to a number of factors:
- Economies of Scale for Manufacturing. As the utility-scale segment grows along with markets in North America and Asia, many players will be able to grow their manufacturing capacity for BOS components and reduce costs. Continued entry of larger players will also enable better hedging of material costs, mitigating the risk of cost fluctuations in commodities such as galvanized steel and aluminum.
- Product Integration. As players in the BOS value chain move to expand their services, cost will be reduced due to cross-training of labor, bundled packages and broader service offerings.
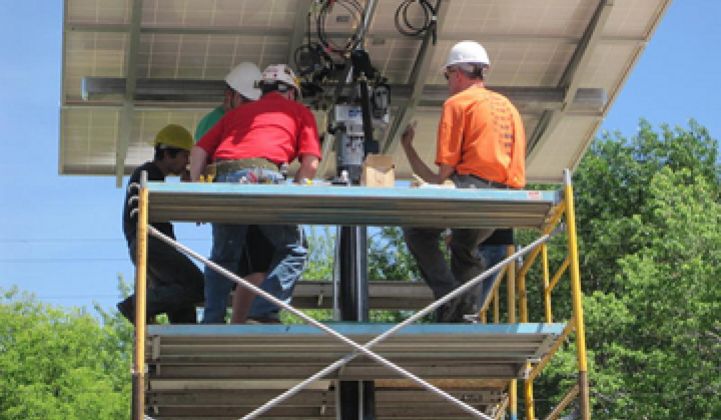
- User-Friendly Designs. Improved system designs can decrease on-site labor costs. For example, structures with modules may be assembled on the mounting structures in a nearby facility, enabling the use of machines to speed up the process. Another example is the integration of a string cable in the mounting structure, eliminating the need to run a string cable from the end of the row to the combiner box.
- Improved Foundations. The cost of foundations can be improved through the use of composite materials and the design of easy-to-install structures.
- Component Technology and Field Architecture. Improvements such as combiner boxes with MPPT and higher DC voltage systems will enable smaller field sizes and therefore will require less trenching, fencing, etc.
- Module Technology. Perhaps most importantly, higher efficiency modules will result in a lower number of modules needed for the same power output as well as larger form factor modules, which will require less labor and fewer electrical connections and mechanical attachments.
The figure below illustrates the cost reduction roadmap for a 10MW blended c-Si system using a fixed-tilt mounting structure in the U.S. We expect BoS costs to fall $0.07/W to 0.08$/W per year from 2010 to 2013 (representing a rate of 5.5% to 6% per year) as a combined result of the factors noted above. It should be noted that our forecast includes an EPC margin of 11% to most accurately approximate the BOS costs currently seen in the market.
FIGURE: BoS Cost Roadmap, 10 MW Fixed Title Blended c-Si Project in the U.S., 2010-2013
_537_269_80.jpg)
Source: Solar PV Balance-of-System: Technologies and Markets
***
This is an excerpt from GTM Research's recent Solar PV Balance of System (BoS): Technologies and Markets report. To download the report's complete Table of Contents and List of Figures, please visit http://www.greentechmedia.com/research/report/solar-pv-bos-2011.


 41
41
 15
15
 9
9