There is a rush for renewable energy in southeastern California. Tehachapi-Mojave has enormous gifts of rich wind and golden sun, as well as other unique characteristics, that has the region at the edge of something as extraordinary as 1849’s Gold Rush.
Right now, the Tehachapi Mountains host the state’s biggest circumscribed installed wind capacity and the Mojave Desert is home to the state’s only solar power plants, a set of trough facilities from Kramer Junction to the border and a solar power tower in Lancaster.
But those installations are mere gestures at what will eventually fill a region that has what has been called “one of the greatest insolations in the world,” “the state’s biggest wind potential” and “wind that peaks during peak electricity demand.”
The California Energy Commission (CEC) is in the process of defining the region’s real potential as the state prepares its march toward obtaining 33 percent of its power from renewables by 2020 and much more in subsequent decades.
“Thirty-three percent is an initial or interim goal,” Michael Valentine, the Assistant Director of the CEC’s Desert Renewable Energy Conservation Plan (DRECP), and Roger Johnson, CEC’s Transmission Corridor Designation Manager, explained, adding: “The desert is a big part of California’s renewable energy future.”
The Tehachapi-Mojave region has roughly 1,000 megawatts (MW) of installed solar and wind capacity, according to Valentine and Johnson. There are 410 MW of solar, over 350 MW in the nine NextEra-operated Solar Energy Generating System (SEGS) trough facilities, 5 MW in the eSolar power tower and the rest in smaller, county-approved installations that are harder for CEC to track.
Tehachapi’s Alta Wind Energy Center (AWEC) and the other projects adjacent to it probably have, according to CEC numbers, some 550 to 600 MW in actual operation, though the developers say it is closer to 710 MW -- but that installed capacity is merely the proof of product.
Already approved and at some stage of construction, Valentine and Johnson reported, are seven solar projects representing 1300 MW of peak capacity and 6 large wind projects with an installed nameplate capacity of 1700 MW. Those 13 developments, though, were only the ones out in front of the Gold Rush.
The hardcore rush may best be represented by the projects now in the permitting process.
“In permitting in 2011,” Valentine and Johnson reported, are “61 solar projects for 3,340 megawatts and 20 wind projects that amount to 2500 megawatts.”
Valentine and Johnson insisted these numbers should be considered estimates because so many factors are at play, ranging from Governor Brown’s drive for development to the region’s unabashedly vocal NIMBYs (Not In My Backyard) and BANANAs (Build Absolutely Nothing Anywhere Near Anything) who could get in the governor’s way (unless they get their fair share of the gold).
Johnson and Valentine compared their permitting process numbers with those of the California Independent System Operator (Cal-ISO), the state’s grid operator, to whom developers must apply for transmission interconnection. The ISO has applications, Johnson and Valentine reported, for 67 solar projects representing about 5,870 MW and 29 wind projects representing roughly 6,400 MW.
The higher numbers from the ISO may be an indication of just how much the Gold Rush mentality is taking hold. Despite the newly instituted high cost for an interconnection application, developers not yet ready to apply for CEC permitting seem nevertheless to be paying the Cal-ISO fee.
“The ISO list undoubtedly includes projects that will never be permitted or built,” Valentine and Johnson agreed. But they could very well be projects sparked by some version of the Gold Rush mentality, they also agreed.
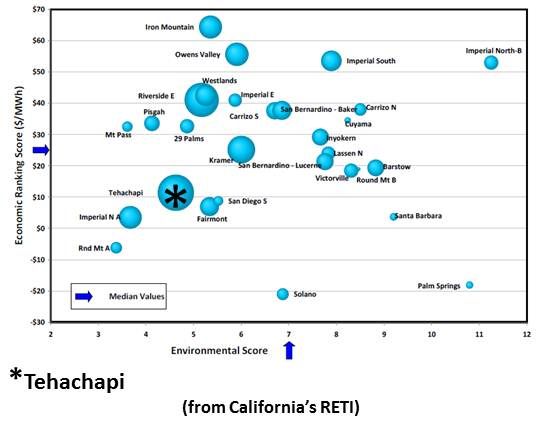
The CEC is working on the complicated question of the region’s full potential. Valentine and Johnson said the state’s report on Competitive Renewable Energy Zones (CREZs) and its updated 2010 Renewable Energy Transmission Initiative (RETI), a plan for the transmission necessary to service the CREZs, together represent the best current estimate. As represented on the RETI bubble chart, Tehachapi-Mojave holds California’s biggest renewables potential.
A major thrust of the CEC’s current work, Valentine and Johnson said, is the DRECP. It will identify renewable sites and more precisely define their potential. An RPS calculator will describe available acreage and its likely load capacity. The DRECP planning process will close at the end of July 2011. A draft plan should be available by January 2012 and California’s overall, long-term development picture should be defined by the first quarter of 2013.
Low parcelization and an agricultural past may, the CEC representatives said, be a key strength of the Tehachapi-Mojave region. There are still large, uninterrupted, but previously degraded parcels available to developers, unlike the large but preserved Bureau of Land Management (BLM) lands farther east and south.
“If you’re trying to assemble a 1,000-acre site, it’s a lot easier to deal with one landowner than 100,” Valentine said.
“That’s one of the strengths of the West Mojave area,” Johnson said. There are still sites comprised of ten or fewer contiguous parcels that constitute two square miles. Plus, “They could be developed without overwhelming habitat or biological impacts,” Valentine added.
And they will be. “After 33% is achieved, California and the country will continue to have the need to transfer the generation of electricity to renewable sources,” Johnson and Valentine said. They are looking out to 2040 or 2050. How much renewable capacity can California build in that time period? “That’s a question we’ll have to answer in the next year or so.”


 41
41
 15
15
 9
9