
The grid is changing from a one-way, centralized electricity delivery system to a distributed, networked system for generating, storing and consuming power -- and the technology is changing a lot faster than the economic and regulatory systems that govern it, as we've seen in states like California and New York that are struggling to catch up.
But what if all this complexity could be boiled down to one metric that captures the costs, benefits and tradeoffs in a way that can serve the grid’s needs, not only on a minute-by-minute basis, but forecast over years to come? Grid software vendor Integral Analytics says it has an answer -- distributed marginal price, or DMP. Consider it the grid-edge equivalent of the localized marginal price (LMP) metric used by transmission grid operators to determine the marginal cost of delivering energy on any given point on the grid, at any given moment in time -- only down to millions of grid endpoints, and forecast over a decade or more.
“Our process goes through the standard calculation methods, to go from house to house to find the true cost to serve,” Tom Osterhus, CEO of the Cincinnati-based privately funded utility software vendor, explained in an interview. “We’re doing direct and accurate marginal costing -- which the regulator always wanted to do, but never had the computing power to do it.”
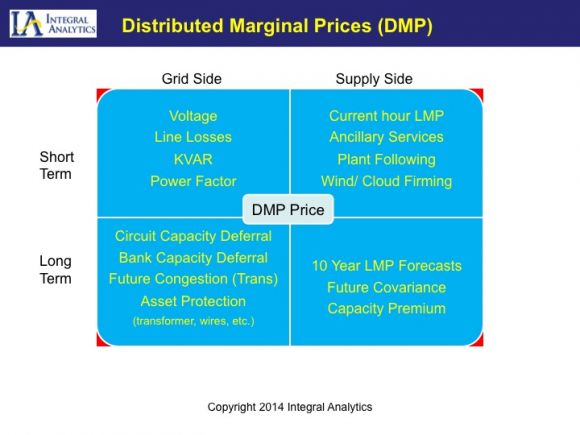
There’s a lot more than the cost per kilowatt-hour of generating power that goes into this calculation. Short-term factors include distance from generation to consumption and consequent efficiency losses; the value of providing reactive power; voltage support and other such technical services at different points on the grid; and broader grid reliability measures. In the long term, you’ve got to calculate how much these grid-edge resources could save you in power plants not built or feeder lines, transformers and substations not upgraded or replaced, and balance out which combination of technologies and strategies can provide the optimal outcome, for utilities and customers alike.
But once it’s created, this DMP metric can serve as a common point of reference for multiple technologies that must be integrated to serve the common cause of delivering the best value for the lowest cost, he said. California regulators have just launched a process to convert a state law demanding integrated distribution grid planning into a working model to use at the state's big investor-owned utilities -- and Integral Analytics, which has been working with the likes of California utility Pacific Gas & Electric and grid operator California ISO, could represent a real-world software platform for making that happen.
These are the kinds of visionary software efforts that Greentech Media will be exploring at our Soft Grid 2014 conference next month in Menlo Park, Calif. The proliferation of smart meters, grid sensors, smart solar inverters, smart thermostats, building energy management systems and other distributed intelligent devices provide the data to make these kinds of software innovations possible. But Integral Analytics (IA) is one of the first to propose a concrete measurement of value for all these very different grid-edge resources as a result.
So how does IA’s software turn reams of data into a guide for moment-to-moment grid energy interactions, as well as insight into long-range distributed energy investment plans? Here’s a breakdown, starting with the stuff that’s happening in real time on the grid’s edge.
IDROP: A real-time solution to the distributed energy value equation
Integral Analytics’ IDROP (Integrating Distributed Resources into Optimal Portfolios) software is, simply put, a platform for monitoring and orchestrating a multitude of distribution grid assets and demand-side resources. IA has deployed IDROP with customers including Duke Energy, which is using it at its McAlpine substation smart grid test bed, and a consortium of Canadian utilities balancing wind power with demand-side resources in the PowerShift Atlantic project.
Today, rooftop solar PV, energy storage systems, volt/VAR optimization equipment, demand response and energy efficiency programs, and other distributed grid resources are managed as separate silos, Osterhus explained. IDROP merges all of the data from these systems, both utility-controlled and customer-owned, into a single measure of grid need from point to point.
“You’ve got to put those costs on a level playing field, dollar per dollar,” he explained. Doing so provides a “heat map” of sorts for each part of the distribution grid, showing which spots are costing the most money at that moment, as well as showing how a combination of distributed resources can help solve the most expensive problems first, at the lowest possible cost.
Here’s an example, plotting a real-world IDROP heat map from an undisclosed customer, with low costs in blue and high costs in red:
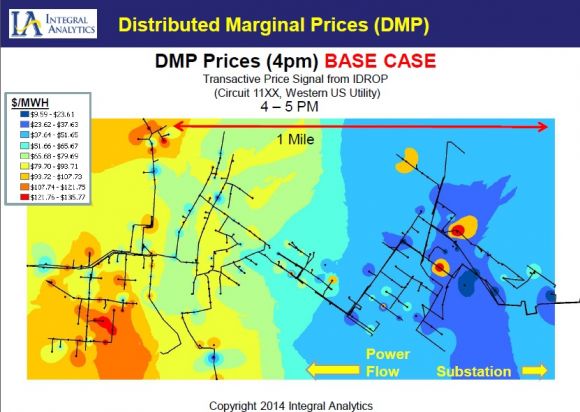
“Those costs are due both to supply and the grid, both kW and KVAR, real and reactive power,” he noted. Today’s grid management systems don’t combine operational and economic metrics to come up with this kind of equation, making it hard to figure out what combination of resources will solve the problem at the lowest price.
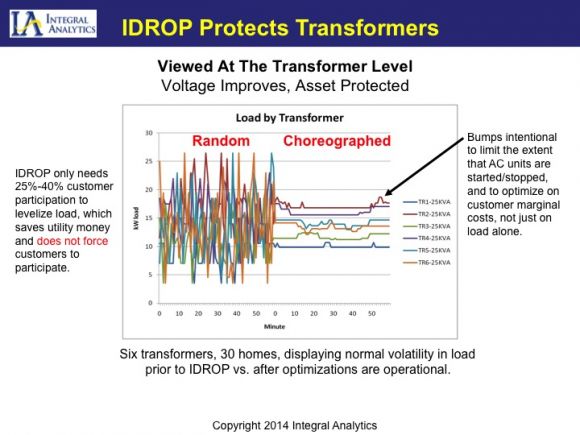
IDROP takes on the challenge first with the demand side, controlling home thermostats and other loads in ways that are invisible to the customers, he said.
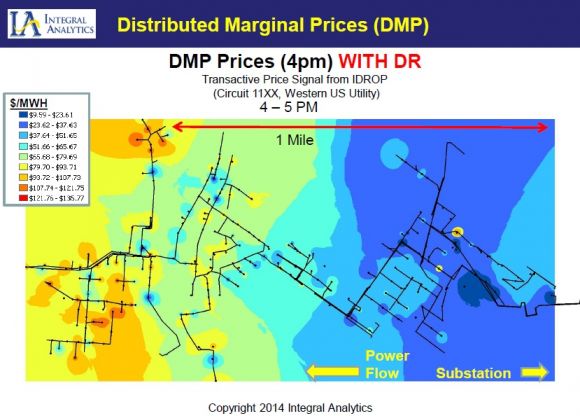
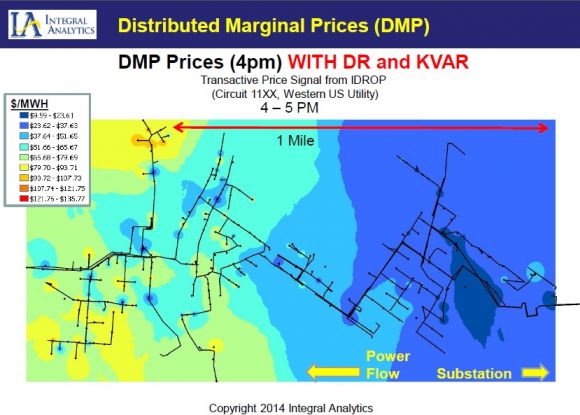
IA has been able to show 10 percent to 30 percent reductions in customer energy usage over five-minute periods, with a reliability that can allow it to be included in utility-grid operator load curve projections. That can “take out a big chunk of the costs -- but it doesn’t get them all,” he said. The next step is to “take KVAR injections, or certain located capacitors, to get the rest,” he said, with the following results:
The IDROP software doesn’t actually execute these grid control commands, he noted. That task could be taken on by the utility’s existing grid control systems, or by the technology platforms with names like DRMS, DEMS and DERMS being developed by grid giants like Siemens, ABB, Schneider Electric, Toshiba, Alstom and General Electric. Rather, it helps systems like these execute the most cost-effective combination of commands, he said.
“The DMPs calculate the right amount in the right place,” he said. “I’m not smearing DR programs everywhere or putting capacitors everywhere. I’m getting at the bulk of avoided costs, by being more intelligent with our targeting.” This slide shows how this looks to one section of the grid with six transformers serving 30 homes:
Prices don’t have to be part of the equation, he noted. The first step is creating a distributed marginal cost (DMC) figure, which tells the utility how much each unit of distributed resource is worth to its internal cost metrics. To be sure, there are a lot of assumptions that go into this calculation, but they’re built on industry-standard methods, Osterhus said, and have been tested out for years with its partners.
DMP could also serve as an important building block for “transactive energy” systems -- the still-experimental IT platforms that allow distributed resources to buy and sell their services to one another and the grid. Most fundamentally, a well-built DMP could serve as a reference point for transactive energy schemes, to make sure they’re not rigged by participants with greater levels of market knowledge, he said -- avoiding the threat of a future Enron of distributed energy gaming the system.
Beyond that, however, DMP can also help deliver a value beyond a price at the moment, he said. That gets us to a second innovation IA is bringing to the grid edge: the concept of a pinpoint measurement of value for grid assets that can be used to plan ahead, for years and even decades to come.
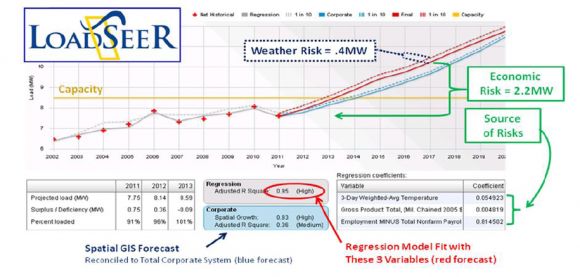
LoadSEER: A crystal ball for grid edge planning
IA’s LoadSEER (Load Spatial Electric Expansion and Risk) software goes after this by taking much of the data that goes into DMP and connecting it with a much broader set of demographic and public-planning data. From there, it predicts electricity demand growth patterns, and the grid investments needed to serve them, down to a neighborhood and address-specific level.
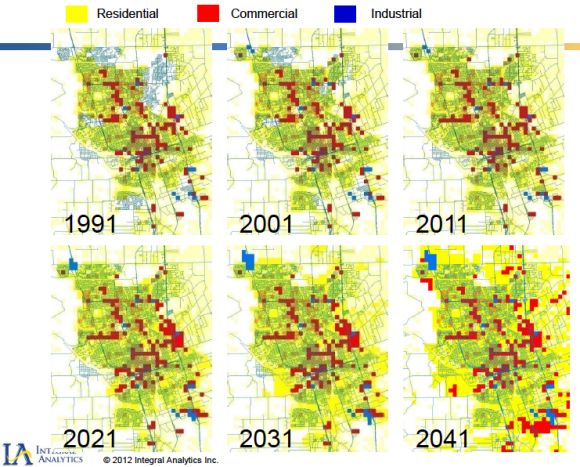
That provides LoadSEER the data it needs to help utilities answer the perplexing questions of capital-expenditure planning on the grid edge. Utilities want to know how to plan distribution grid investments to minimize problems and optimize outcomes, from the spread of distributed energy assets -- including many that are not under the utility’s direct control. At the same time, grid operators and regulators want to know how these new grid-edge assets, and the investments aimed at managing them at a local scale, are going to affect their broader, system-wide forecasts and investment plans.
“This granular forecasting is at the heart of being able to even start calculating avoided capital costs,” Osterhus said. “If you’re going to displace the need for a transformer, or other localized assets, you can’t do it with just the hours of a conservation program. You can’t do it with just demand response hours. You have to have energy efficiency and demand response hours, both the hours and the locations, and DG [distributed generation] hours as well.”
If that sounds complicated, it is -- IA has been working on LoadSEER for the past five years. But it also has some marquee customers who’ve been using the software in real-world planning, including Avista, FortisBC, Nashville Electric, and its longest-running customer, Pacific Gas & Electric.
PG&E has used LoadSEER for its past two planning cycles, applying its insights to “circuit load forecasting, identifying capacity shortfalls, incorporating microgrid impacts, ensuring consistency with corporate planning, streamlining regulatory data requirements, creating more defensible long-term load forecasting methods, and automating and streamlining various aspects of the decision and approval process,” according to a 2012 white paper (PDF).
That’s a comprehensive list of the things utilities will need to do to make distributed solar PV, behind-the-meter batteries, plug-in EVs, and fast-responding demand response work to their benefit over the long haul. And in places like Hawaii, New York and California, they’ve become pressing tasks. In the past year, each of those states has launched major distribution grid redesigns, meant to create more network-based, customer-centric grid planning regimes.
California’s redesign was formally opened earlier this month, when the California Public Utilities Commission (CPUC) opened a proceeding on how to force the state’s big three investor-owned utilities to create distribution resource plans (DRPs) that take grid edge assets into account. AB 327, a massive energy law passed last year, requires each utility to submit proposals for this change by July 2015. One could imagine PG&E including the data it’s compiled using LoadSEER for this plan, though the utility hasn’t yet announced anything on the subject.
California utilities invest about $6 billion a year in their distribution grids, using decade-old forecasting and planning methods that don't take distributed energy resources into account. Now they’re being asked to take a portion of these massive budgets and invest them in the grid edge -- and prove they’re “cost-effective” -- a term that state regulators have cited, but have not yet defined.
“The state’s job is to ensure reliability at least cost,” Osterhus said. “Only a DMC/DMP approach ensures this. The only unknown is to what extent regulators will allow for earnings for utilities” that deploy their capital to solve grid-edge challenges, either via shared savings of the demonstrated avoided costs, or in higher rates of return, he said. That could mean utilities owning and controlling their own grid-edge assets and measuring the avoided costs, or creating programs, rate structures and markets that enlist and incentivize customer-owned assets to participate.
IA isn’t the only company working on software to help in this transition to the grid edge. Companies like GRIDiant (acquired by Toshiba’s Landis+Gyr) and Power Analytics (acquired by Causam) are helping to break down the utility operations side of the calculation, and research projects like the Department of Energy’s Pacific Northwest Demonstration Project are tackling the economic side, to name only a few examples.
No matter which combinations of software end up being deployed for this purpose, one thing's for sure: California's multi-billion-dollar cost-benefit equations are only a foreshadowing of the decisions to be faced by utilities around the world as rooftop solar systems, backyard batteries, plug-in vehicles and energy-smart homes and buildings proliferate on the grid. We're going to need common measures of value for all of these next-generation grid assets. Perhaps DMP will be one of them.


 41
41
 15
15
 9
9