
California has more solar power than any other state in the U.S. -- and that's always been the case.
Every summer, the California Independent System Operator issues a press release explaining that the state has hit another record for solar power generation. The most recent came in July, when CAISO reported that the state hit 8,030 megawatts of solar on July 12 at 1:06 p.m., almost 2,000 megawatts more than the previous summer.
With more solar panels being installed every day, new records are as predictable as the sunrise. But strangely, everyone gets the numbers wrong.
California is, of course, the national leader. But CAISO only tracks solar power systems that sell into the wholesale market that the operator manages. That includes plants like the massive new Solar Star project, a 579-megawatt power plant in Antelope Valley, which went on-line in June. Or First Solar’s twin 550-megawatt PV plants, Topaz and Desert Sunlight.
CAISO’s data misses all the solar that is installed behind the meter -- all the customer-owned solar that doesn’t sell power into the market.
“We don’t see behind-the-meter solar installations,” verifies agency spokesperson Steven Greenlee. If the systems don’t report to CAISO, CAISO can’t track them.
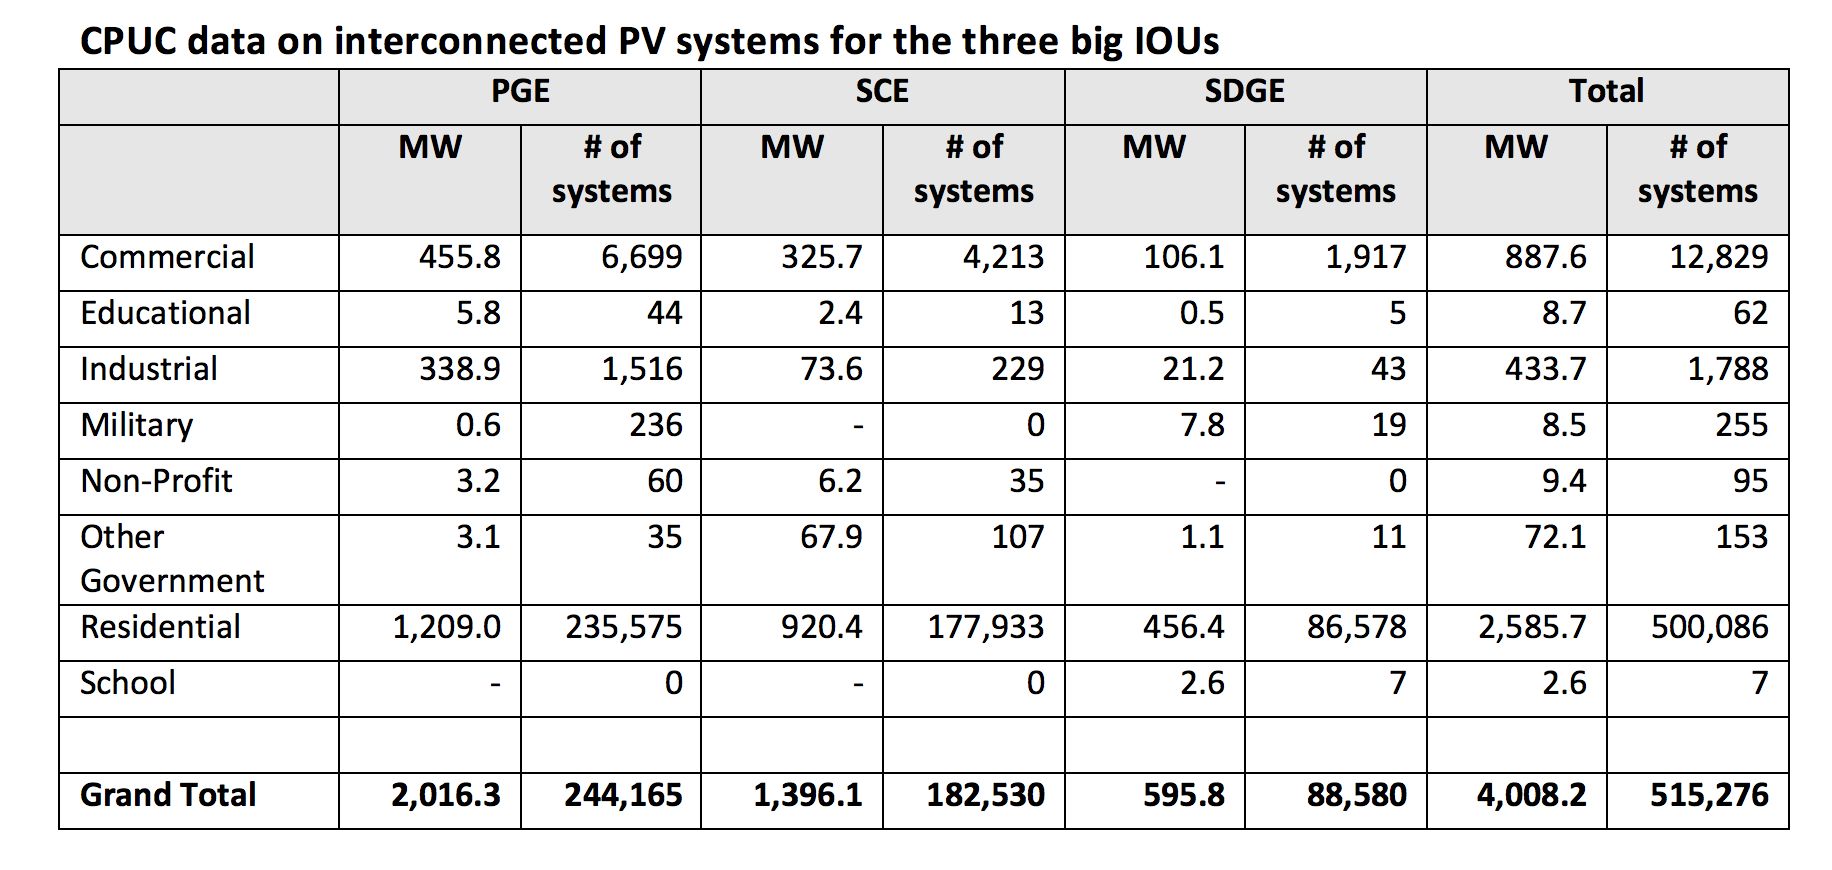
According to data compiled by the California Public Utilities Commission (CPUC), the state has another 4,406 megawatts from 567,293 solar projects installed behind the meter.
But this data is a little hard to handle as well.
On its California Solar Statistics website, CPUC reports rebates given out -- not systems interconnected. The rebate program has been phasing out for each utility and type of development, which means the data misses out on recent trends.
CPUC does let you download the interconnection data in raw form, if your Excel can manage a 156-megabyte spreadsheet with over 500,000 lines.
CPUC also doesn’t track publicly owned utilities (POUs), but it borrows that data from the state energy commission. This includes solar powerhouses like the Los Angeles Department of Water and Power (LADWP) and the Sacramento Municipal Utility District (SMUD).
CEC just released new data from the POUs through the end of 2015, but this data also includes only rebates granted, and not interconnected systems. Since most POUs are still giving out rebates, the numbers are probably close, but not necessarily the same.
With that in mind, POUs gave rebates for 82.7 megawatts of new PV to make a new cumulative total of 398 megawatts. That is slightly down from the previous year, when 86.3 megawatts were incentivized. LADWP and SMUD accounted for over half the new awards, reporting 30 megawatts and 19 megawatts, respectively, in 2015, bringing them up to totals of 143 megawatts and 85 megawatts, respectively.
You can get more of this juicy data in GTM Research’s upcoming Solar Market Insight Q3 update in early September.
One important implication of this data gap is the effect on net demand -- total demand minus wind and solar generation -- and for tracking progress on solar.
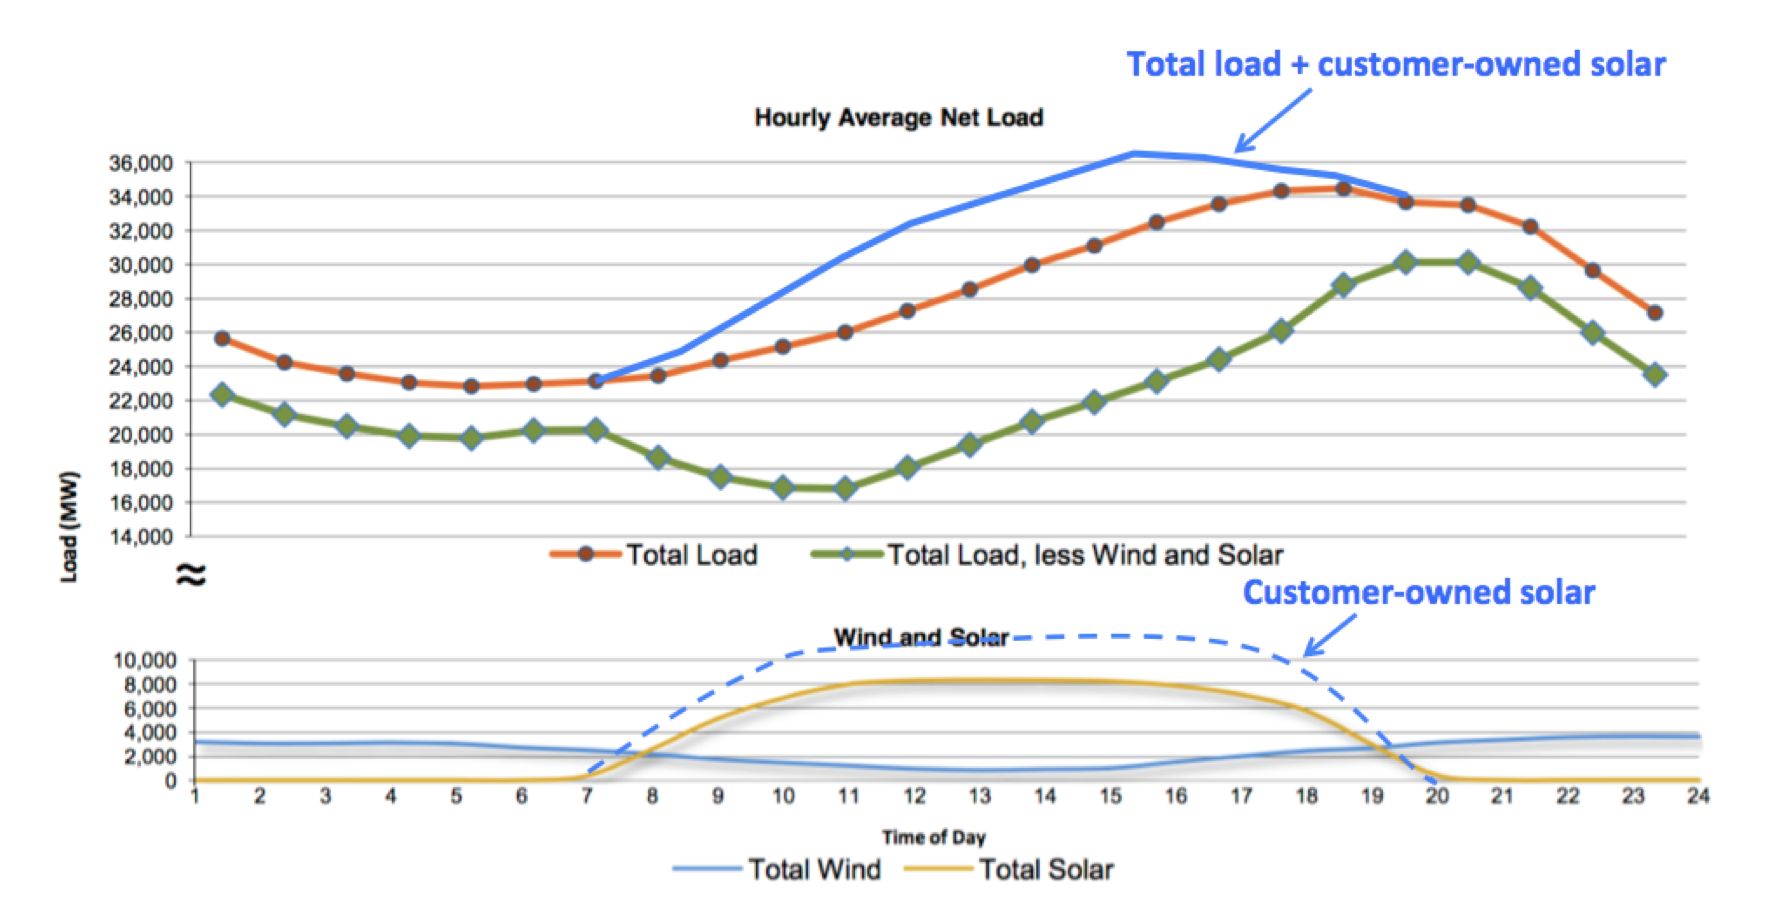
CAISO has a very helpful website and app that track system information in real time, like many system operators do now. CAISO reports net demand as it happens, so you can see the effect of wind and solar generation on the system -- the source of the famous duck curve. (Deep data is available via its OASIS system.)
But since it doesn't track customer solar, the lines don’t tell the whole story. The orange line in CAISO’s figure (below) tracks “total load” for August 7, 2016, while the green line is net load, or “total load, less wind and solar.”
If we account for over 4 gigawatts of customer solar, that means electric demand is really higher during the day, but is being partly met by the customers’ own solar panels. The added blue line sketches out “total load + customer solar.”
So California’s new solar power record on July 12? Probably more like 11 gigawatts, not 8 gigawatts.
As customer solar continues to grow, CAISO’s “total load” line will continue to fall in the midday hours, pushing down the “net load” line as well. And since all solar is driven by the sun, both customer and wholesale solar will add to the duck curve, increasing the afternoon ramp and decreasing the need for baseload.
Next time you hear that California has set a new solar record, or you are watching the energy transformation unfold on that cool CAISO app, remember that there is more happening than meets the eye.
***
Join GTM for the 6th annual U.S. Solar Market Insight conference. Underpinned by years of in-depth market analysis published in conjunction with SEIA, this conference will give you exclusive access to the top industry executives and thought leaders while providing actionable insights into the U.S. solar industry. Find out more here.


 41
41
 15
15
 9
9