
Factors such as new fossil-fuel drilling techniques, drastically cheaper renewable energy generation, rapidly improving battery storage and power electronics, and the rise of information technology are changing our energy system faster than ever before.
As a result, policymakers accustomed to operating, planning, regulating and legislating in an environment where capital deployment happens over the course of years and assets maintain value over the course of decades must now adapt their practices to account for accelerating change and disruptive feedback loops.
But policymakers rely heavily on quantitative analysis to understand how to manage these rapid changes, and quantitative analysis (particularly forward-looking projections) relies heavily on underlying assumptions. The quality and breadth of these assumptions are crucial to good decisions. Cost assumptions, in particular, can be major drivers of study conclusions.
Informed policy-making means study assumptions (especially deployment and cost figures) need to be scrutinized in each instance, and updated when necessary. Unfortunately, deployment and cost numbers for new technologies are systematically underestimated, thus undermining smart policy choices. So how can policymakers get it right?
Case in point: Solar cost projections
Solar photovoltaics (PV), currently disrupting the electricity sector, best illustrate this tension. Costs are admittedly hard to forecast, especially for an earlier-stage technology still undergoing innovation, but empirical evidence shows current methods for estimating costs are failing -- especially important when policy decisions rely on outdated inputs.
The economic fundamentals of solar are governed by the interplay between rapid deployment and fast annual decreases in total install costs per unit. Rapid deployment decreases costs through “learning by doing” (also known as learning or experience curves), and lower costs make solar more economically attractive to drive further increases in deployment, inducing a “feedback loop.”
Failure to account for cost and capability improvements for new technologies often follows a typical sequence. First, a drawn-out stakeholder consultation and study process results in cost figure time-lags. Second, a desire to lend credibility by using “conservative” assumptions and the need for consensus further encourage pessimistic estimates of functionality, cost and deployment rates. The real kicker comes when exponential increases in deployment (as have happened for solar and wind generation) far outpace predictions.
Three current examples: EIA, NREL, WECC
Three instances from top institutions illustrate this point: The U.S. Energy Information Administration’s (EIA) recent Annual Energy Outlook 2015; a 2014 re-evaluation of scenario costs for the National Renewable Energy Laboratory’s (NREL) 2012 Renewable Electricity Futures study; and a detailed 2014 capital cost estimator report for the Western Electricity Coordinating Council (WECC).
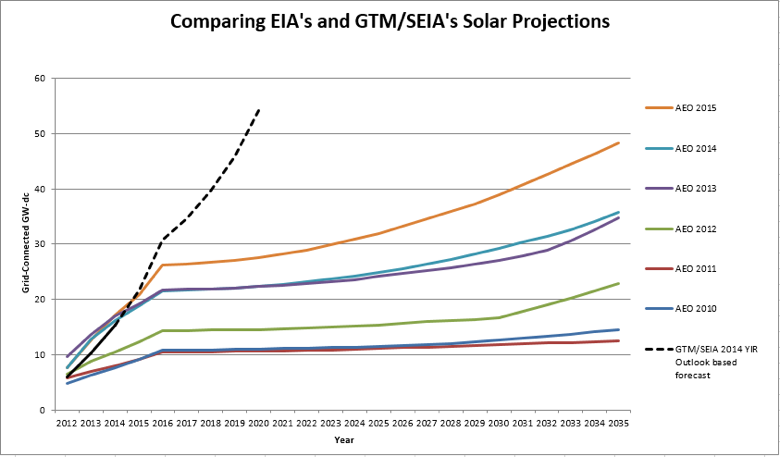
EIA’s Annual Energy Outlook projections for peak solar capacity are a particularly egregious case of time-lag.
Previous outlooks reveal consistent underestimation, which is a real problem because EIA projections directly inform national policymakers. If EIA fails to use current data in its estimates, then policymakers, businesses, and other stakeholders have a harder time making intelligent decisions or appreciating how best to manage change happening on the ground.
For example, the North American Electricity Reliability Corporation (NERC) worried the 281 terawatt-hours of annual renewable electricity generation called for by 2020 in EPA’s proposed Clean Power Plan would unduly affect reliability, when in fact this is exactly the amount of renewable energy already generated in 2014 with no ill effects. Because NERC’s November 2014 report relied on outdated Annual Energy Outlook 2013 data, policymakers made an inaccurate assessment.
In NREL’s Renewable Electricity Futures study, a focus on consensus and technical feasibility drove conservative cost and deployment projections. Starting from 2010 cost data, the report concluded in 2012 that an 80 percent renewable energy future was technically feasible with moderate cost increases under conservative technology improvement assumptions.
Just two years later, the 2014 follow-up study examined new cost reduction scenarios from 2010 for 2050. It compared cost impacts from the 2012 study’s most aggressive Incremental Technology Improvement (ITI) scenario for 2050 with a new Advanced Technology Improvement (ATI) scenario. Remarkably, the 2012 study’s ITI scenario’s 2050 cost estimates have already been achieved in 2014 for solar (GTM Research/SEIA U.S. Solar Market Insight) and wind (LBNL).
What’s more, new 2014 cost numbers are much more in line with 2020 cost estimates of the updated ATI scenario (which now looks like it also has conservative cost estimates) and that scenario reaches 80 percent renewables in 2050 at almost no increased cost relative to business as usual.
The conclusion: 80 percent renewable energy in 2050 is technically feasible and economically neutral compared to a business-as-usual case. This represents a significant difference from the original study's conclusions, with important policy implications. Since solar and wind deployment are both accelerating and the grid study’s ATI scenario freezes cost reductions after 2020 while maintaining conservative assumptions about grid management improvements, an American grid powered by 80 percent renewables could feasibly be cheaper than business as usual by 2050.
A third case, the recent “Capital Cost Review of Power Generation Technologies” for WECC’s 10-year and 20-year planning processes, also misses the mark on solar cost declines (despite the use of solid methodology) because it fails to recognize solar’s exponential deployment pattern.
Driving blind with outdated numbers
Deployment rates and learning rates (cost decreases with every doubling of market size) are the two main ingredients for estimating future cost reductions. WECC applies learning rates consistent with historical data, but uses deployment rates that are far too low. For instance, WECC estimates 2015 global solar installations of around 200 GW-dc, while current projections are roughly 15 percent higher.
So while GTM Research/SEIA’s Q4 2014 Solar Market Insight report found residential PV costs already fell 10 percent during 2014 to $3.48/Watt-dc, the WECC review doesn’t anticipate these costs declines until 2020. Conservative growth estimates rapidly accumulate over longer time horizons to severely skew planning exercises, leaving policymakers constantly playing catch-up to the facts, unable to manage change effectively or properly plan for the future.
By using two- or three-year-old numbers for solar and other disruptive technologies, policymakers are driving blind, underestimating the deployment rate for new technologies and overestimating their costs. With one foot in the past and one foot in the future, policymakers can’t fully take advantage of important new technologies available today.
How can policymakers sort through the data?
We shouldn’t shoot the messengers for using outdated cost and deployment rate numbers. It’s hard to stay on top of the rapidly changing clean energy landscape, and the admirable urge to use numbers vetted by a stakeholder process tends to introduce even more delay. What's more, some good reasons exist to be conservative; for example, analyses using conservative cost estimates may be more widely accepted.
However, unrealistic numbers threaten smart policy, so here are three suggestions to enable better-informed policymaking:
- When considering cost or deployment projections for rapidly evolving technologies, insist the most recent publicly available data be used, or at least analyzed as a scenario. Hold consultants accountable for presenting numbers more representative of the current real-world information and use multiple sources to triangulate.
- Request studies that test a wider range of cost assumptions to understand sensitivities and ensure policy isn’t being set based on out-of-date information. Use meaningful variations in exponential rates to bracket uncertainty and to mitigate against the natural human tendency to think in terms of linear extrapolations.
- Build continuous improvement into policies and/or use an iterative approach -- don’t lock yourself into policy assuming future prices, technologies or capabilities.
Policymakers, as well as other stakeholders, should think critically about best practices for study inputs, and consider investing more in data gathering where necessary. In a fast-changing energy landscape, there’s no excuse for driving blind.
***
Eric Gimon and Sonia Aggarwal represent America’s Power Plan.
Thanks to Shayle Kann, Jim Baak and Michael O’Boyle for their input on this piece. The authors are responsible for its final content.


 41
41
 15
15
 9
9