The solar panels springing up across California's rooftops like flowers after a desert rainstorm may look pretty to environmentalists and homeowners seeking energy independence. But to grid operators and utilities, they could look more like weeds in a well-kept garden.
That’s because small-scale rooftop solar PV systems are almost completely un-instrumented, in terms of telling utilities how much energy they’re feeding back onto distribution grids and when they’re doing it. That’s not such a big deal when there isn’t much solar out there -- but California, with more than 170,000 distributed solar systems now connected to the grid, is well on its way past the point where the systems' collective impact on grid stability can be ignored.
Greentech Media has been covering developments in managing distributed solar PV, one of the many grid-edge challenges that utilities are facing. Smart inverters, solar monitoring systems, smart meters, and other technology innovations could help play a role in turning "invisible" rooftop solar into monitored grid assets.
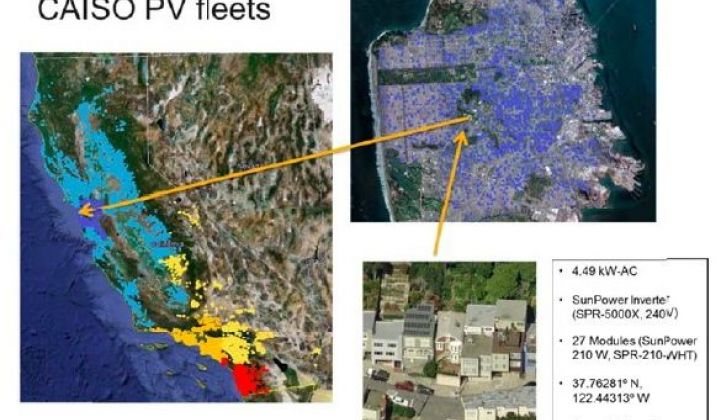
Or maybe all that rooftop solar can be managed via virtual metering and measurement, like Clean Power Research is trying to do. For more than a decade, the Napa, Calif.-based company has been working on grant-funded projects tracking California’s solar growth, using a combination of rooftop PV interconnection data and satellite weather data to create geographically precise predictions of the minute-to-minute generation status of the state’s distributed solar fleet.
The software it has built to do that, SolarAnywhere FleetView, is now providing solar forecasting for entities including the California Independent System Operator (CAISO), the state’s grid operator. Earlier this month, the Department of Energy issued a set of grants from its SunShot solar initiative, including a few that could help Clean Power Research expand the capacity of its software to provide even more fine-tuned, and future-forward, predictions of distributed PV as a grid resource.
Building a Model for a State’s Worth of Invisible Solar Inputs
The first grant of $500,000 comes from SunShot’s Solar Utility Networks: Replicable Innovations in Solar Energy (SUNRISE) program, and is aimed at putting the company’s existing work with CAISO and other partners into operational use. But it’s also the fruit of years of effort to integrate real-world solar system data and ever-changing weather and irradiance data that, together, can yield a picture of sunlight being converted to solar electrons across the state.
“We started this work two CSI grants ago,” Tom Hoff, Clean Power Research’s founder, said in an interview last week. "CSI" refers to the California Solar Initiative, the state incentive program that’s pushed rooftop solar into the mainstream. The two grants, awarded in 2010 and 2012, helped Clean Power Research develop the “spatial and temporal resolution” of its SolarAnywhere satellite-based irradiance dataset, to bring resolution of how much sunlight is reaching the earth down to increments of minutes and square kilometers.
It also included work involving Clean Power Research’s database of solar PV systems, conveniently built up as part of its job managing the CSI incentive program. The PowerClerk software that resulted from that work now has tons of data on individual PV systems in terms of generation capacity and characteristics, all mapped geographically and in grid-interconnection terms, that can be matched with real-time satellite data.
The data flowing from that combined model is what Clean Power Research has been feeding CAISO for the past eight months or so, Hoff said. “We have a draft version running where every half-hour, we take all those 170,000 systems, simulate the output, add it all up, and forecast it,” he said. With its new SunShot grant, the company will be taking another step to integrate that data into CAISO’s Automatic Load Forecasting System (ALFS), which predicts loads at day-ahead and hour-ahead intervals.
While PV plants of 1 megawatt or larger are monitored and metered by CAISO, systems under that size aren’t -- and nearly 90 percent of connected distributed generation capacity in California is behind the meter. That customer-side DG, almost all of it solar PV, added up to 1,785 megawatts as of the end of last year, according to a report from engineering firm Black & Veatch (PDF), published in May by the California Public Utilities Commission.
In other words, those distributed solar systems are “really bending the load,” Hoff said, with a combined capacity that’s bigger than the state’s biggest nuclear power plant. That’s going to lead to all sorts of complications pertaining to how CAISO balances hour-to-hour power supply against demand, as CAISO’s well-known “duck curve,” which forecasts the expected increase in solar’s impact on the grid over the next decade, illustrates.
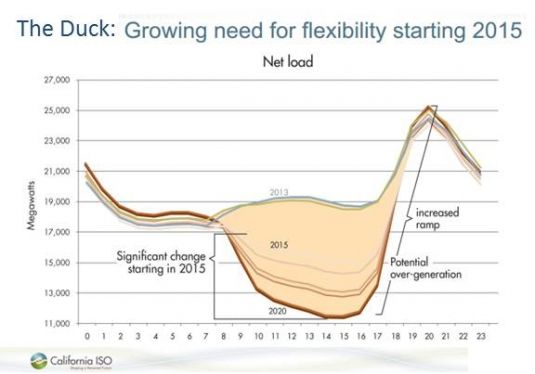
But that graph, which shows a giant hump in midday solar power supply, won’t always look the same, said Mark Liffmann, VP of sales for Clean Power Research. “During the shoulder season in California, you’re going to have one cloudy day, followed by one sunny day,” he said. “On any given day, it could look how it looks in 2012 -- or it could look like their vision of a sunny day in 2020.”
Having access to half-hourly data that reflects the electricity flowing from 170,000 previously unmetered, unmonitored PV systems could be critical information for CAISO as it seeks to manage its hour-by-hour power supply-demand balancing tasks. The goal of its SunShot grant is to prove that it works for CAISO, and could work for other grid-balancing authorities across the country.
Breaking Down Solar’s Local Impacts, Today and Years Ahead
Beyond these kinds of system-wide predictions, there’s a world of more discrete grid challenges to take on, Hoff said. “The system we’ve built could go down and do fleet simulations, whether it’s twenty feeder systems, or specific feeder X, Y or Z,” he noted.
That’s important, because the earliest and most disruptive effects of distributed solar PV are expected to come at the local scale. As Black & Veatch’s May report for the CPUC notes:
“Though each distribution circuit is different in its capacity to accommodate DG, in most cases a larger number of small DG systems spread over a wide area will have less negative impact than a smaller number of large DG systems concentrated in a single area. This is especially true for variable resources like solar PV and wind, whose variability is 'smoothed out' to some extent when aggregating the output of many generators over wide geographic areas.”
Clean Power Research is a subcontractor on two other SunShot-grant-funded projects that are working on this challenge, one in California’s capital of Sacramento, and the other with East Coast utility Pepco.
The University of California at San Diego is the lead on the first project, which won a $499,900 SUNRISE grant last week to demonstrate software that can provide better real-time predictions of the effects of different PV penetrations via “clustering” analysis in the Sacramento, Calif. region. Sacramento Municipal Utility District (SMUD), a public utility with a growing share of solar rooftops, will be expanding on work with Clean Power Research and UCSD on its 2010 CSI grant-funded program to try and reduce the costs of real-time dispatch and automatic generation control systems used to manage generation assets.
The Pepco project, funded by a $979,293 grant, is “feeding our data directly into a distribution planning tool,” to model impacts on the distribution grid down to the feeder line level, Hoff said. The idea here is not just to find out what today’s feeder lines can handle in terms of distributed PV, but how to pick and choose which feeder lines to upgrade to handle future PV penetration, he said.
Planning like this requires a “very detailed technical analysis” that builds on past data to predict future loads down to the circuit level, he said. Clean Power Research, which has provided solar incentive program support for regions across the country, is one such source of that kind of data, as are solar monitoring providers like Locus Energy, Draker and DECK Monitoring, which was just acquired by Also Energy to create the country’s largest commercial and utility-scale solar monitoring company.
The fruits of properly integrating and analyzing data like this for distribution grid planning could be significant. The Pepco project is aimed at enabling a “significant increase in solar penetration capacity in the distribution system, 10 percent to 15 percent beyond where it would be” otherwise, according to DOE’s SunShot grant announcement last week.
It’s also going to be critically important to ensure that distributed PV can keep growing in a way that supports, rather than destabilizes, the grid -- a key issue in the fights over net metering and other solar PV policies now underway between utilities and solar industry advocates. Here’s the money quote on that subject, again from Black & Veatch’s CPUC report:
“What many industry observers agree on is 'DG that is at the right place at the right time will create the greatest value, while additional electricity supply in the wrong place at the wrong time could result in added costs to the system,' as stated in a report published by Rocky Mountain Institute and PG&E in March 2012. However, it is difficult to develop quantitative measuring and monitoring protocols to systematically gauge whether DG is being deployed at the right place at the right time, and there has been no effort yet in California to do so.”


 41
41
 15
15
 9
9